Document Properties Document Title Timeline View
 Prepared for
NHS Connecting for Health
Version 1.0.0.0 Baseline
Prepared by
Clinical Applications and Patient Safety Project
NHS CUI Programme Team
Cuistakeholder.mailbox@hscic.gov.uk
Prepared for
NHS Connecting for Health
Version 1.0.0.0 Baseline
Prepared by
Clinical Applications and Patient Safety Project
NHS CUI Programme Team
Cuistakeholder.mailbox@hscic.gov.uk

PREFACE
- PREFACE
- 1 INTRODUCTION
- 2 TIMELINE GUIDANCE OVERVIEW
- 3 GUIDANCE DETAILS FOR THE TIMELINE VIEW LAYOUT
- 4 GUIDANCE DETAILS FOR THE DISPLAY OF THE TIMELINE VIEWING AREA
- 5 GUIDANCE DETAILS FOR THE DISPLAY OF TIMELINE ENTRIES
- 5.1 Introduction
- 5.2 Guidelines
- 5.2.1 Timeline Entries: Generic Considerations
- 5.2.2 Timeline Entries with No Significant Duration
- 5.2.3 Timeline Entries with Known Duration
- 5.2.4 Timeline Entries with Open Duration
- 5.2.5 Timeline Entry Labels
- 5.2.6 Row Identifier Cells
- 5.2.7 Displaying Crowded Timeline Entries and Labels
- 5.2.8 Displaying Graphs in Conjunction With a Timeline View
- 6 GUIDANCE DETAILS FOR NAVIGATING TIMELINE ENTRIES WITHIN A CHOSEN TIME PERIOD
- 7 GUIDANCE DETAILS FOR DISPLAYING SETS OF RELATED EVENTS
- 8 GUIDANCE DETAILS FOR NAVIGATING TIME
- 9 DOCUMENT INFORMATION
- APPENDIX A USABILITY PRINCIPLES
- APPENDIX B STUDY ID 33: EXECUTIVE SUMMARY
- REVISION AND SIGNOFF SHEET
Source PDF: timelineview.pdf
Documents replaced by this document None Documents to be read in conjunction with this document Medications Management – Drug Administration – User Interface Design Guidance 4.0.0.0 Medications Management – Medication Line – User Interface Design Guidance 2.0.0.0 Medications Management – Medications List – User Interface Design Guidance 1.0.0.0 Displaying Graphs and Tables – User Interface Design Guidance 2.0.0.0 This document was prepared for NHS Connecting for Health which ceased to exist on 31 March 2013. It may contain references to organisations, projects and other initiatives which also no longer exist. If you have any questions relating to any such references, or to any other aspect of the content, please contact cuistakeholder.mailbox@hscic.gov.uk Patient Safety Process The development lifecycle for this design guide includes an integrated patient / clinical safety risk assessment and management process. Known patient safety incidents relevant to this design guidance area have been researched and reviewed as part of ongoing development. The resulting guidance points aim to support mitigation of these known patient safety risks. In addition, the developers of this design guide have undertaken a patient safety risk assessment to identify new risks that could potentially be introduced by the guidance points in this document. Any potential risks identified have been assessed and managed to support the ongoing clinical safety case for this design guide. The Hazard Log records all the risks that have been identified during development and describes mitigatory actions that, in some cases, will need to be taken by users of this design guide. The Hazard Log is a live document that is updated as the design guide is developed and maintained. Until this design guide has received full Clinical Authority to Release (CATR) from the NHS Connecting for Health (CFH) Clinical Safety Group (CSG) – based on an approved Clinical Safety Case – there may be outstanding patient safety risks yet to be identified and mitigated. Additionally, users implementing applications that follow this design guide’s guidelines (for example, healthcare system suppliers) are expected to undertake further clinical safety risk assessments of their specific systems within their specific context of use. Refer to NHS Common User Interface for further information on the patient safety process and for the safety status and any relevant accompanying safety documentation for this design guide.
1 INTRODUCTION
This document provides guidance for the design of Timeline Views. It describes the area of focus, lists mandatory and recommended guidance points with usage examples and explains the rationale behind the guidance.
Patients’ medical records contain vast quantities of information which play a pivotal role in clinical decision making. This decision making relies critically upon swiftly gleaning an accurate and complete picture from a catalogue of previous and planned events while identifying cause-effect relationships and trends. In addition, being able to visualise planned activities in the context of past events provides the clinician with an ‘integrated vision’ of what has happened, what is about to happen, and what has just failed to happen. Timeline Views of patient clinical data provide this visualisation.
Timelines provide an easy mechanism to view and compare both items with duration, and single events, against time. There are a few current clinical systems which employ timelines of some description to convey information, sometimes to the patient, other times to the clinician or multi-disciplinary team.
There are not, however, guidelines which Independent Software Vendors (ISVs) can follow to help mitigate patient safety risks which may be encountered when showing clinical data in a Timeline View. This guidance document provides guidelines relating to the use of timelines to convey duration and event data in clinical systems developed by ISVs.
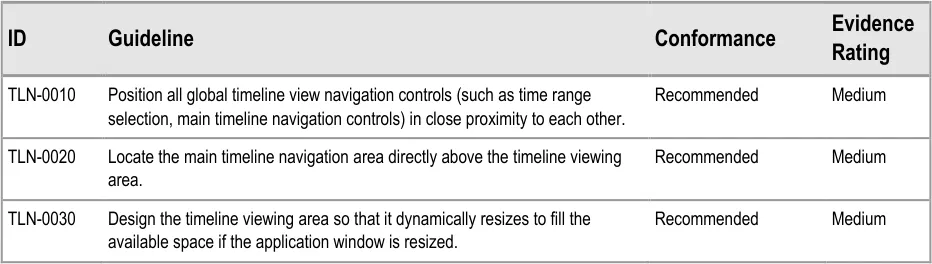
To indicate their relative importance, each guideline in this document is ranked by Conformance and by Evidence Rating . Table 1 defines those terms:
Conformance Indicates the extent to which you should follow the guideline when defining your UI implementation. There are two levels:
Mandatory - An implementation should follow the guideline
Recommended - An implementation is advised to follow the guideline
Evidence Rating Summarises the strength of the research defining the guideline and the extent to which it mitigates patient safety hazards. There are three ratings (with example factors used to determine the appropriate rating):
Low:
Does not mitigate specific patient safety hazards
User research findings unclear and with few participants
Unreferenced usability principles indicate the design is not significantly better than alternatives
Medium:
Mitigates specific patient safety hazards
User research findings clear but with few participants
References authoritative guidance (for example, from National Patient Safety Agency (NPSA), Institute for
Safe Medication Practices (ISMP) or World Health Organization (WHO)) that is potentially soon to be superseded
Referenced usability principles indicate the design is significantly better than alternatives
High:
Mitigates specific patient safety hazards
User research findings clear and with a significant number of participants
References recent authoritative guidance (for example, from NPSA, ISMP or WHO)
Referenced usability principles indicate the design is significantly better than alternatives
Table 1: Conformance and Evidence Rating Definitions
Page 1
Copyright ©2013 Health and Social Care Information Centre
HSCIC Controlled Document
Note
Refer to section 9.2 for definitions of the specific terminology used in this document.
1.1 Customer Need
The visualisation of clinical data against time is commonplace in clinical systems, but tends to be limited to quantitative information such as physiological observations data. However, the ability to visualise clinical event and duration information (in isolation or in combination with quantitative information such as ‘observations’ data) gives clinicians more context as to the patient’s condition and may assist them in identifying patterns in the data available for a patient.
Pattern detection is a universal human capacity which people tend to do very efficiently and often subconsciously. However, the detection and meaning of a data pattern can be heavily influenced by the way in which the data is presented, and misinterpretation may occur if the data is not presented in a way that clinicians can easily understand.
Note
When clinical data is visualised in a Timeline View, there is the possibility that clinicians may incorrectly interpret coincidental occurrences in time of clinical event and duration information as being evidence of a cause-effect relationship.
However, wrongly assuming a cause-effect relationship is not unique to Timeline Views, and clinicians have a professional responsibility to fully validate such assumptions before acting on them.
Research undertaken by the NHS in Timelines in Health care {R1} identified the following areas, amongst others, where the visualisation of clinical events and durations for a patient could be beneficial for patient care and improve patient safety:
- Medications History
The visualisation of prescribed medications and data relating to the administration of those medications
- Medical History (the ‘past’ visualisation of the patient)
Being able to view at varying levels of detail the past medical history recorded for the patient, to enable the clinician to easily assimilate it
- Transfer of Care (the ‘about now’ visualisation of the patient)
In addition to transfer of care within hospital teams, transfer of care between secondary care and primary care, as well as between different hospitals, could benefit from the visualisation of patient data on a timeline.
- Secondary uses (for example, Clinical Audit)
The electronic format of medical records and coding in general already facilitates clinical audit. However, timelines may enable audit to be taken a step further and allow causal relationships to be identified. This guidance draws upon User Interface (UI) current best practice and upon research into the use of timelines in clinical settings.
This guidance is for use by Independent Software Vendors to ensure that good design principles support clinicians’ interpretation of duration and event information, reveal critical patterns and assist users in accessing more detailed information relating to the data being viewed.
Page 2
Copyright ©2013 Health and Social Care Information Centre
HSCIC Controlled Document
1.2 Scope
1.2.1 In Scope
Navigating vertically and horizontally (potentially simultaneously)
Indication of data beyond the visible area of the canvas
How to navigate the timeline canvas to view timeline data
How to indicate that there is information outside the current viewing window which may be relevant to the user
Indication of now, past and future How to identify whether the range of time for which the user is currently viewing data is in the past, the future, or spans past and future.
Position of timeline element labels How to position the timeline canvas elements (labels, durations, events) in a patient-safe manner
Visual design of continuous duration timeline elements
How to display duration elements on the timeline canvas
Visual design of discrete event timeline elements How to display event elements on the timeline canvas
Display of timeline element attributes How to display information related to a duration or event element (such as dosage and rate for medications prescriptions)
Position of timeline elements on the canvas How to position timeline elements on the canvas to optimise the canvas space available whilst maintaining patient safety
Mixing timelines with graph data / integrating quantitative data with timeline data
How timeline data and quantitative data (such as physiological observations data) can be displayed in the same view - high level guidance only
Background and gridlines How to display the canvas on which the timeline elements are displayed
Time navigation High level guidance relating to changing the viewed time range
Levels of detail High level guidance on adjusting the level of detail shown for the timeline elements
‘Time window’ selection High level guidance only
Table 2: Subject Areas Covered by This Guidance
1.2.2 Out of Scope
This section defines areas that are not covered in this guidance. Although there may be specific risks associated with these areas that are not addressed in this guidance, it is likely that the principles in this guidance will extend to Timeline Views in many of the areas listed in Table 3.
Table 3 lists the subject areas that are not covered in this guidance:
Grouping timeline entries How to show different types of timeline data on the same canvas
Designing for multiple time axes This guidance is applicable to where time is displayed on the x-axis only
Collapse/expand control The appearance and interaction behaviour of any user control that collapses and expands (that is, hides and reveals) timeline visualised data
Sorting, filtering and grouping How to sort, filter and group timeline entries(for example, by title, time of occurrence or by some other data taxonomy attribute)
Non-linear timescale Displaying data on a timeline where the time axis is non-linear (such as logarithmic)
Page 3
Copyright ©2013 Health and Social Care Information Centre
HSCIC Controlled Document
Linkage of control variables How to link controls on the form (for example, linking the level of detail shown for element attributes with the time window selection control so that for large time windows, minimal attributes are displayed)
Adding, removing or moving other data series
Accessing more info by navigating to or revealing more data
How to manage which data series are displayed as timelines, including the method of selecting from a list of available data series
How to access further information related to a selected item by navigating to another view or revealing the information in parallel with the timeline (for example, within a ‘pop-up’ dialogue)
Default time window The time period to be displayed by default (that is, when a user accesses a Timeline View for the first time within a session)
Defaults for controls The defaults for controls (such as level of detail and section collapse/expand)
Representing absence of data How to indicate when information for a data series or type is not available to the system either temporarily (for example, due to a hardware failure) or for more fundamental reasons (such as lack of compatibility between systems)
Representing uncertainty How to graphically represent such notions of uncertainty as ‘event occurred sometime between January and March 2008’, ‘patient self-administered during Tuesday evening’, and ‘condition is likely to clear up within next 2 months’.
When to use a timeline representation When (and when not) to use a timeline representation as opposed to other representations of the same data.
Table 3: Subject Areas Not Covered by This Guidance
Note
Listing an item as out of scope does not classify it as unimportant. Project time and resource constraints inevitably restrict what can be in scope for a particular release. It is possible that items out of scope for this release may be considered for a future release.
1.3 Assumptions
A1 The quality (that is, provenance, accuracy, and completeness) of the data displayed in the Timeline View is of an acceptable level. Data quality will be particularly important in scenarios where there are multiple data sources (for example, from primary and secondary care settings) as the quality of the data may vary between sources.
Although the quality of data is not in scope for this guidance, the following risks were recorded during user research (see APPENDIX B):
Coding of data is suboptimal; for example, coding is not good quality, or at the ‘wrong’ level for displaying on timeline
(where coding is at symptomatic level rather than at underlying etiology), or different codes are used to represent the same concept
System cannot display all the data, or cannot be certain that all data is there
User infers from the absence of unavailable data that no event(s) occurred
Data is known to be missing but a ‘best estimate’ is not displayed
If timelines are not implemented based upon encoded data (which aids aggregation of results) and are not in a record
which uses an individual coded statement approach, then Timeline Views may misrepresent the data stored in the system, and therefore clinicians may gain a mistaken or (unnecessarily) incomplete understanding of the patient
Page 4
Copyright ©2013 Health and Social Care Information Centre
HSCIC Controlled Document
A2 The system performance is adequate to display the quantity of data without significant delays (for example when scrolling through large quantities of data).
Although system performance is out of scope for this guidance, approaches that may improve performance recorded during research are:
Cache data directly adjacent to the currently viewed time period (a technique used by popular Internet mapping sites to
enable seamless scrolling to adjacent areas)
When navigation beyond the adjacent time periods is being performed, only update the viewing area once the user has
completed the action
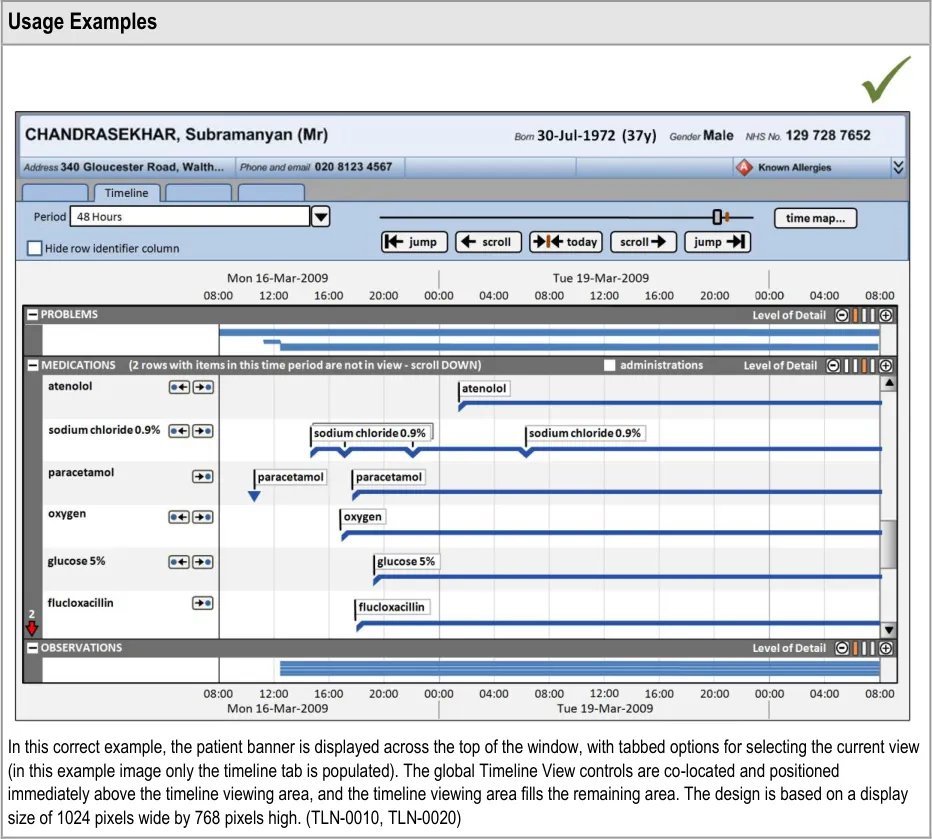
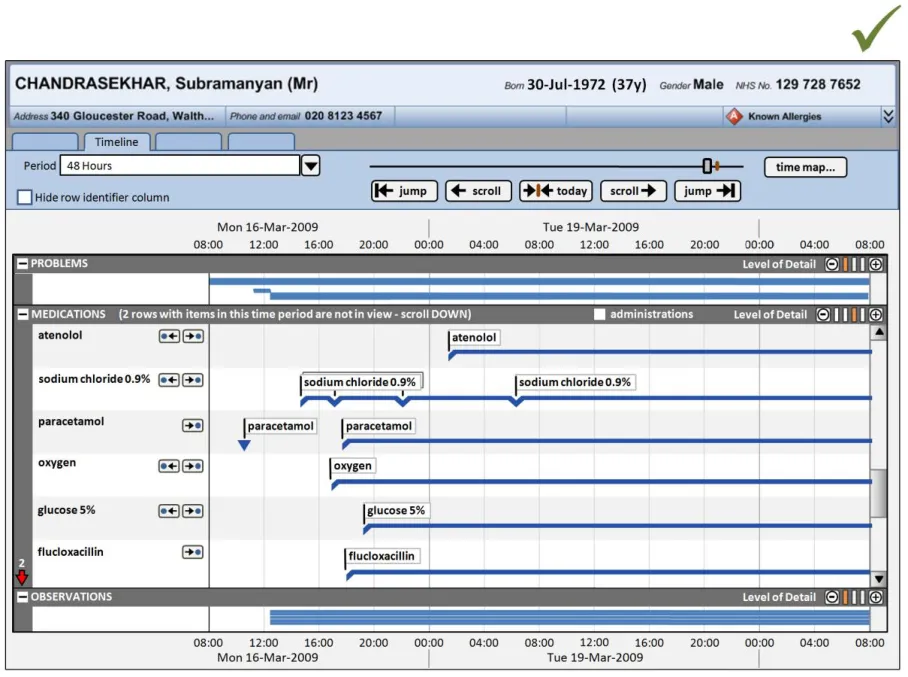
A3 The minimum screen resolution used by the clinician is 1024 x 768 pixels, although a higher resolution may be employed.
A4 Medications viewed on a timeline will be shown using the intended start and end dates of the course of medication.
A5 The Timeline View is not the only view of patient medical data in the Clinical System. All the data shown on the Timeline View is accessible through other views, including the view that represents the data as entered into the system.
A6 Timelines are implemented based upon encoded data which aids aggregation of results, and a record which uses an individual coded statement approach.
A7 Source data for the timeline supports duration, explicitly or by inference
Table 4: Assumptions
1.4 Dependencies
D1 The following design guidance documents (changes in these documents may affect current guidance):
Medications Management – Drug Administration – User Interface Design Guidance
Medications Management – Medication Line – User Interface Design Guidance
Medications Management – Medications List – User Interface Design Guidance
Displaying Graphs and Tables – User Interface Design Guidance
Table 5: Dependencies
Page 5
Copyright ©2013 Health and Social Care Information Centre
HSCIC Controlled Document
2 TIMELINE GUIDANCE OVERVIEW
This guidance document provides high-level guidance for the implementation of a Timeline View within an ISV application. It aims to create a framework that will allow a variety of clinical data to be displayed in a timeline format. This can be any clinical data where temporal aspects are of interest (that is, the start and end times, duration and timing compared to other events).
This guidance does not seek to describe safe default settings for particular data-types in particular clinical contexts (for example, the safe default settings for displaying inpatient medications in a Timeline View). Guidance that does describe these kinds of safe defaults can be found in Medications Management – Medications List – User Interface Design Guidance {R8} and Medications Management – Drug Administration – User Interface Design Guidance {R6} .
The usage examples throughout this guidance display medications data. The settings the usage examples show (such as the level of detail per medication) should not be taken as safe for display in every clinical context where that medication is used.
Note
Significant patient safety risks were identified which can only be mitigated when taking into account the specific context of use. System implementers should conduct a detailed patient safety risk assessment to ensure the safe use of the timeline in their particular context.
Refer to sections 5.2.1, 6.2.3 and 7.2.1 for further details.
For more information on the safe display of medications please see:
-
Medications Management – Drug Administration – User Interface Design Guidance {R6}
-
Medications Management – Medication Line – User Interface Design Guidance {R7}
-
Medications Management – Medications List – User Interface Design Guidance {R8}
-
Medications Management – Search and Prescribe – User Interface Design
Guidance {R15}
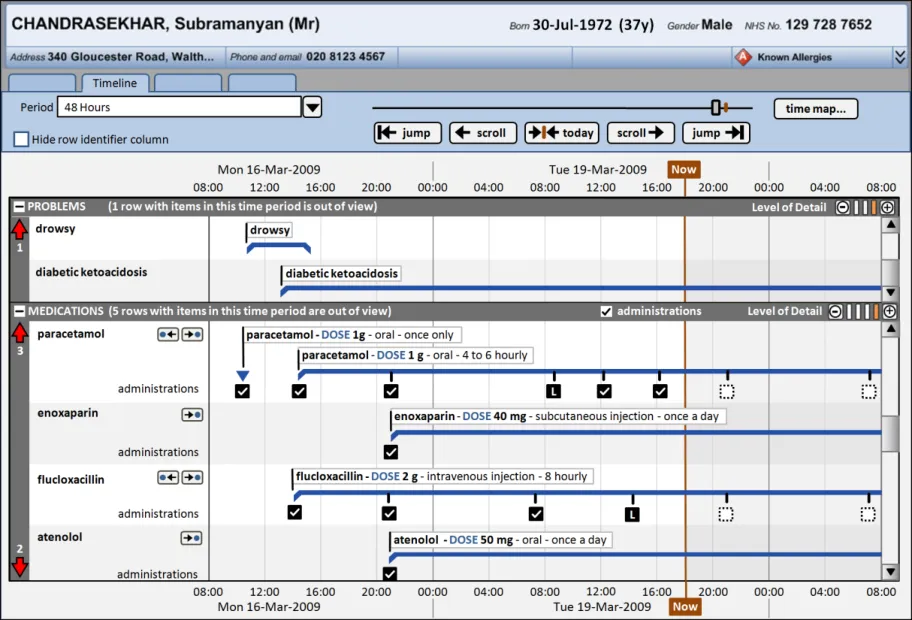
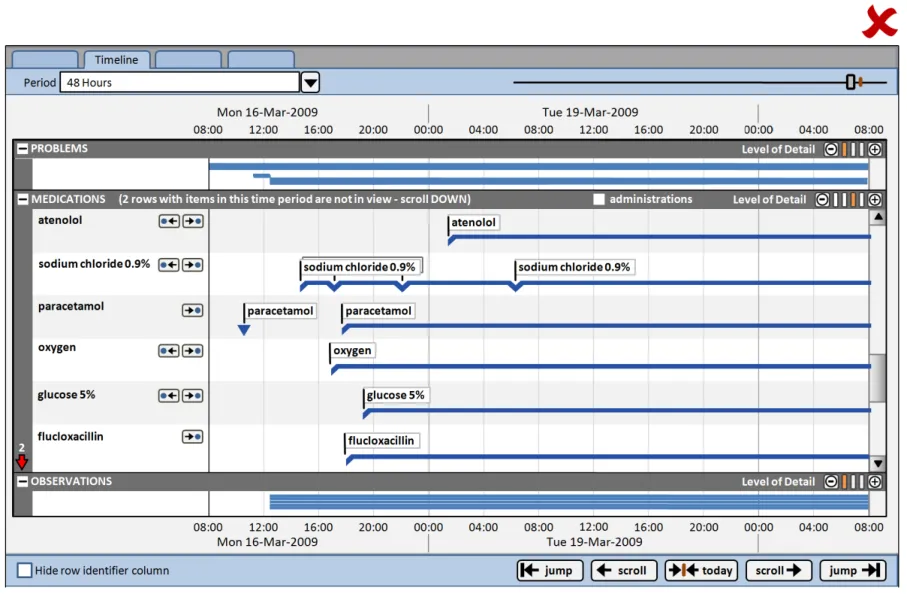
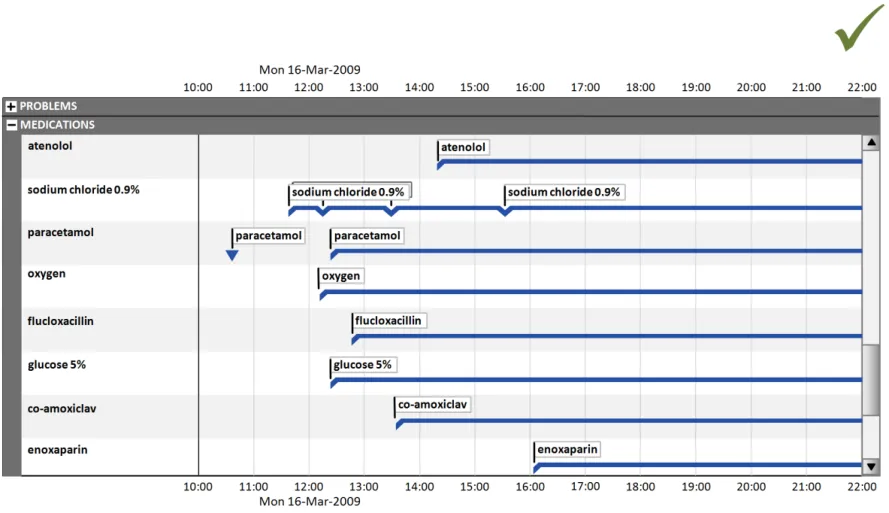
Figure 1 shows how a Timeline View might look when displaying patient medications in an inpatient context. The default settings, such as how much detail is displayed per medication and whether administration status is shown, are notional and not part of this guidance.
Page 6
Copyright ©2013 Health and Social Care Information Centre
HSCIC Controlled Document
Figure 1: Possible Timeline View in an Inpatient Context
The guidelines illustrated by the usage examples can be applied to other data-types in other clinical contexts. Similarly, any medication-specific guidance points could be abstracted to a higher level to also apply to other data-types.
Important
The visual representations used within this document to display the guidance are illustrative only. They are simplified in order to support understanding of the guidance points. Stylistic choices, such as colours, fonts or icons are not part of the guidance and unless otherwise specified are not mandatory requirements for compliance with the guidance in this document.
2.1 Rationale Summary
The rationale for the current guidance draws on several pieces of evidence.
Research:
- Secondary research
Existing guidelines and standards
UI best practice
Clinical timelines literature:
Gaining New Medical Insights through Interactive Visual Exploration {R10}
LifeLines: Using Visualization to Enhance Navigation and Analysis of Patient Records {R11}
LifeLines: Visualizing Personal Histories {R12}
TimeLine: Visualizing Integrated Patient Records {R13}
Page 7
Copyright ©2013 Health and Social Care Information Centre
 HSCIC Controlled Document
Viewing personal history records: A comparison of Tabular format and graphical presentation using LifeLines {R14}
- Primary research
Interviews with health care professionals, including doctors
- Regular consultation with experts
A panel of clinical experts
A technical audience (developers)
Usability Principles (see APPENDIX A for details on these principles):
-
Nielsen’s usability heuristics
-
Shneiderman’s eight golden rules of interface design
-
ISO 9241: Characteristics of presented information (taken from ISO 9241-10: 1996
Ergonomic requirements for office work with visual display terminals (VDTs) — Part 10: Dialogues principles {R4} )
Existing Standards:
- BS ISO 9241-10:1996 Ergonomic requirements for office work with visual display terminals
(VDTs): Part 10: Dialogues principles {R4}
Evolving Standards:
-
Displaying Graphs and Tables – User Interface Design Guidance {R5}
-
Medications Management – Drug Administration – User Interface Design Guidance {R6}
-
Medications Management – Medication Line – User Interface Design Guidance {R7}
2.2 Summary of Guidance
Table 6 summarises the content of this document by outlining each area of guidance (along with a cross-reference to the relevant section) and providing a visual example to illustrate how it might be implemented.
Note
Design illustrations are best viewed on a screen in colour.
Section 3 provides guidance on the overall layout of the Timeline View, including the positioning of the patient banner, options to navigate to other views, and the main timeline navigation controls.
Page 8
Copyright ©2013 Health and Social Care Information Centre
 HSCIC Controlled Document
Section 4 includes guidance on the appearance of the timeline viewing area, including background colours and row delineation, and time axis markers. The indication of past, present, and future time periods is also detailed.
Section 5 provides guidance for timeline entries (including entries with no duration, known duration, and open duration), timeline entry labels, and row identifier cells.
Section 5 also provides guidance on the display of graphs in conjunction with timeline entries.
Some quantitative data is better represented as a graph (for example, observations such as temperature, blood pressure, and so on.) These can be viewed in conjunction with a timeline representation of other data to provide comprehensive patient data visualisations.
Copyright ©2013 Health and Social Care Information Centre
Page 9
HSCIC Controlled Document
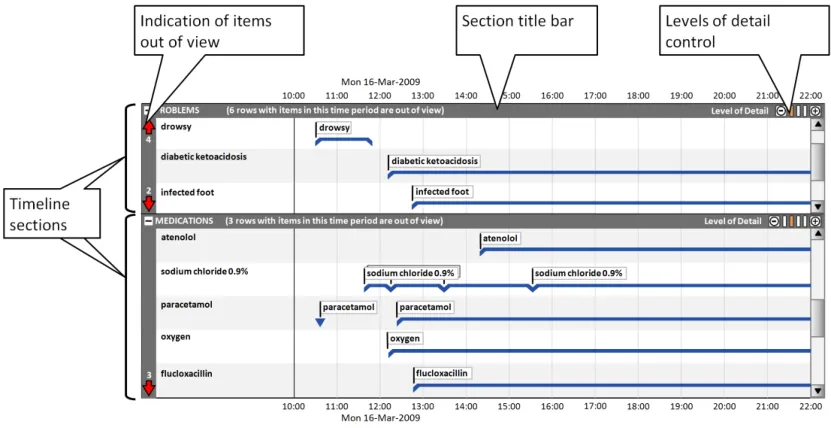
Section 6 includes guidance on using timeline sections to group entries, and covers the display of section title bars, indication of any timeline entries within the chosen period that are out of view, and controlling the level of detail displayed in each section.
When the level of detail displayed in each timeline section can be controlled by the user, they can make best use of the available viewing space for their particular task.
For example, clinicians may wish to compare a medication’s dose changes (requiring a high level of detail for the ‘medications’ section) with the patient’s health issues (viewable at a lower level of detail for the ‘problems’ section).
Section 7 provides guidance on the positioning and appearance of sets of events related to timeline entries (for example, Pharmacist Review events), including multiple sets.
This section also covers the display of drug administrations as a related set of events.
Copyright ©2013 Health and Social Care Information Centre
Page 10
HSCIC Controlled Document
Section 8 contains guidance for the selection of the viewed time period, navigation to time periods adjacent to the current time period and larger scale navigation to time points throughout the total available time period.
Table 6: Summary of Guidance
Copyright ©2013 Health and Social Care Information Centre
Page 11
HSCIC Controlled Document
3 GUIDANCE DETAILS FOR THE TIMELINE VIEW LAYOUT
3.1 Introduction
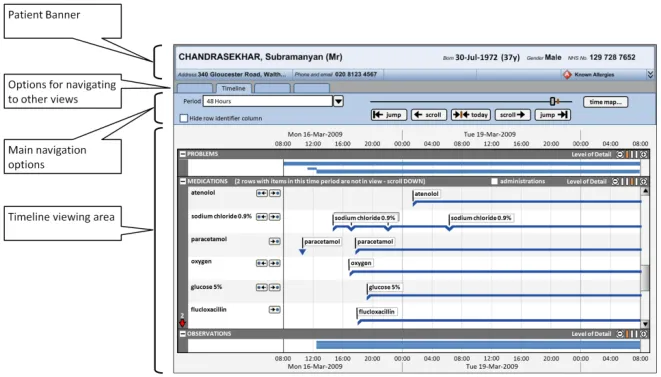
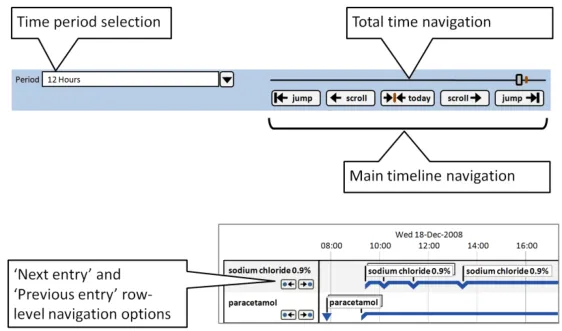
This section provides guidance on the overall layout of the Timeline View, including the positioning of the patient banner, options to navigate to other views, and the main timeline navigation controls. Figure 2 illustrates those features:
Figure 2: Timeline View Features Covered in this Section
3.2 Guidelines
3.2.1 Timeline View Structure

Page 12
Copyright ©2013 Health and Social Care Information Centre
HSCIC Controlled Document
Page 13
Copyright ©2013 Health and Social Care Information Centre
HSCIC Controlled Document
Page 14
Copyright ©2013 Health and Social Care Information Centre
HSCIC Controlled Document
4 GUIDANCE DETAILS FOR THE DISPLAY OF THE TIMELINE VIEWING AREA
4.1 Introduction
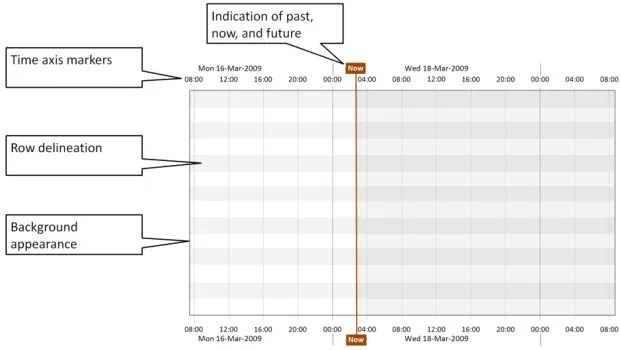
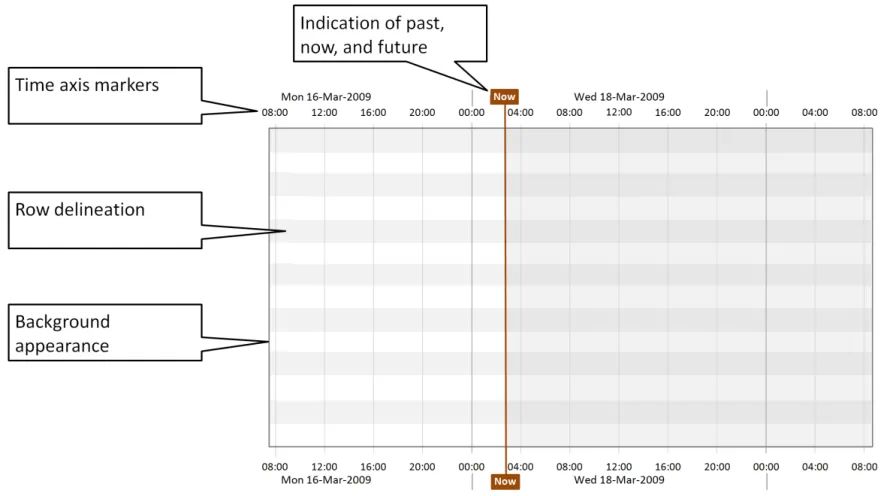
This section includes guidance on the appearance of the timeline viewing area, including background colours and row delineation, and time axis markers. Guidance on how to indicate past, present and future time periods is also included. Figure 3 illustrates those features:
Figure 3: Timeline View Features Covered in this Section
4.2 Guidelines
4.2.1 Timeline Viewing Area Canvas and Time Markers
Use these guidelines in conjunction with the time axis guidelines found in Displaying Graphs and Tables – User Interface Design Guidance {R5} .
Page 15
Copyright ©2013 Health and Social Care Information Centre
HSCIC Controlled Document
Page 16
Copyright ©2013 Health and Social Care Information Centre
HSCIC Controlled Document
Page 17
Copyright ©2013 Health and Social Care Information Centre
HSCIC Controlled Document
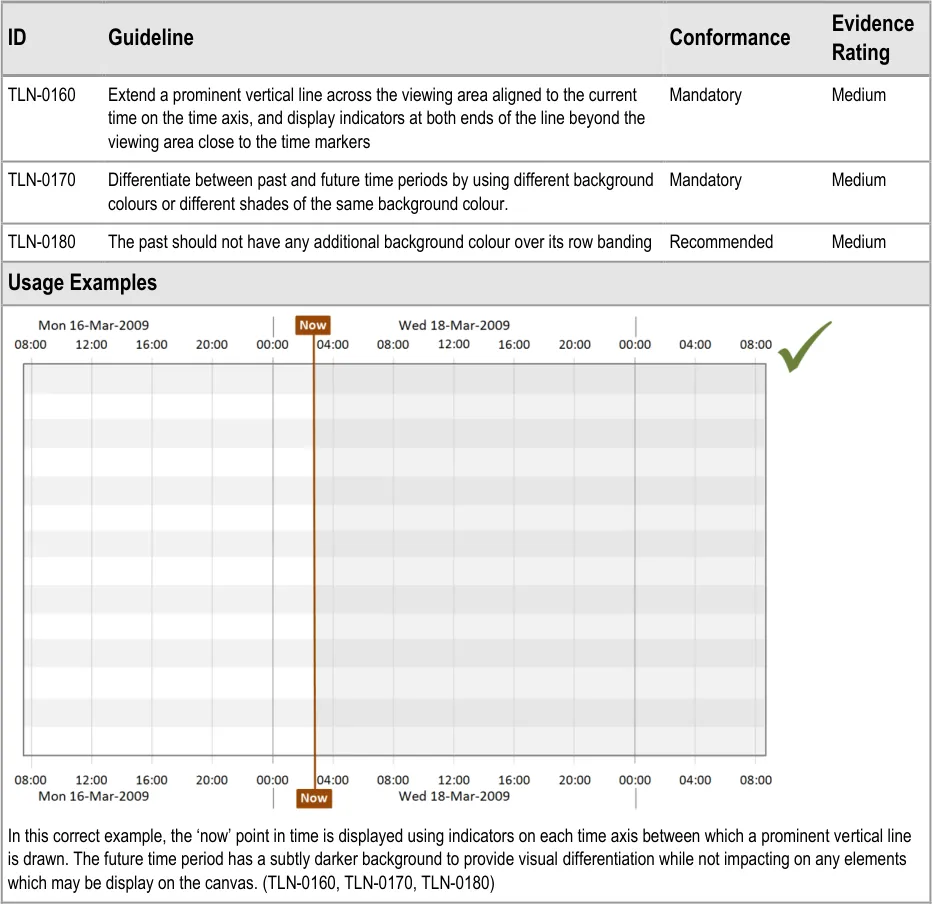
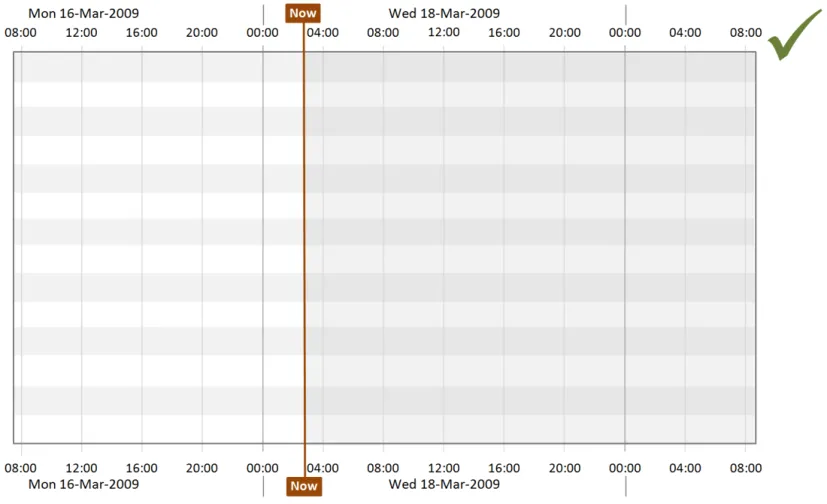
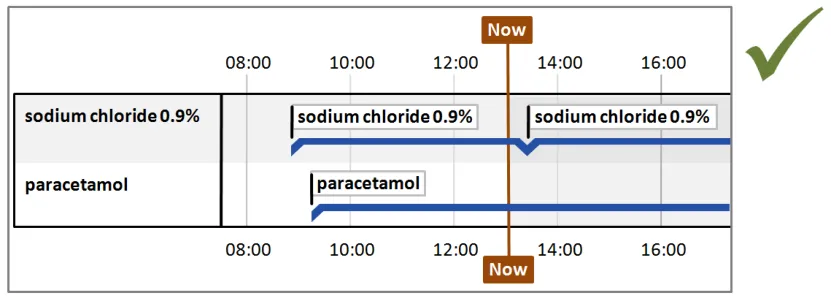
4.2.2 Indication of Past, Now and Future
Page 18
Copyright ©2013 Health and Social Care Information Centre
HSCIC Controlled Document
Page 19
Copyright ©2013 Health and Social Care Information Centre
HSCIC Controlled Document
5 GUIDANCE DETAILS FOR THE DISPLAY OF TIMELINE ENTRIES
5.1 Introduction
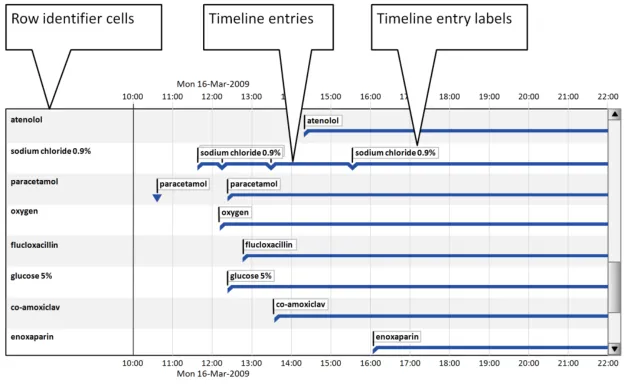
This section provides guidance for timeline entries (including entries with no duration, known duration, and open duration), timeline entry labels, and row identifier cells. Figure 4 illustrates those features:
Figure 4: Timeline View Features Covered in this Section
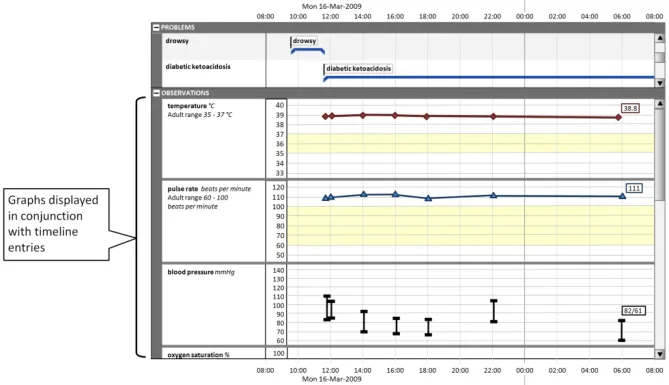
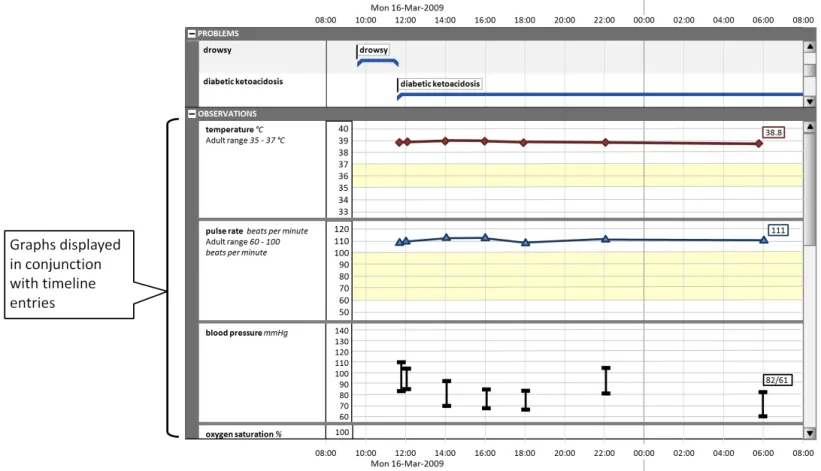
This section also provides guidance on the display of graphs in conjunction with timeline entries, as shown in Figure 5:
Figure 5: Display of Graphs with Timeline Entries
Page 20
Copyright ©2013 Health and Social Care Information Centre
 HSCIC Controlled Document
5.2 Guidelines
5.2.1 Timeline Entries: Generic Considerations
Timeline entries are visualisations of medical record entries plotted against time. They can represent data at a point in time or over a duration.
Page 21
Copyright ©2013 Health and Social Care Information Centre
HSCIC Controlled Document
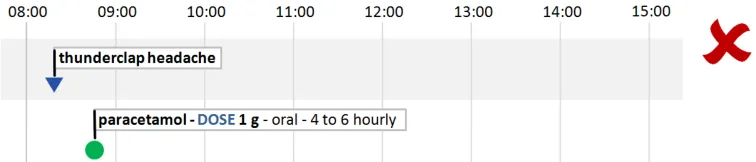
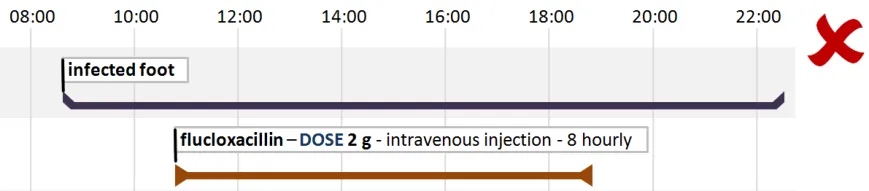
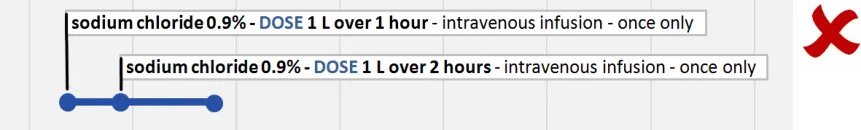
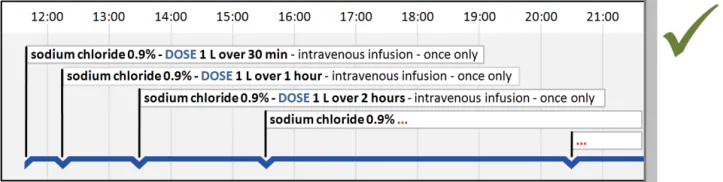
5.2.2 Timeline Entries with No Significant Duration
Some timeline entries occur at a point in time and have no duration. Examples of timeline entries with no duration are:
- ‘Once only’ prescriptions (other than once only infusions) that have no significant duration
(for example, tablets)
- General notes recording (for example, ‘past history of appendicectomy’)
Page 22
Copyright ©2013 Health and Social Care Information Centre
 HSCIC Controlled Document
Page 23
Copyright ©2013 Health and Social Care Information Centre
HSCIC Controlled Document
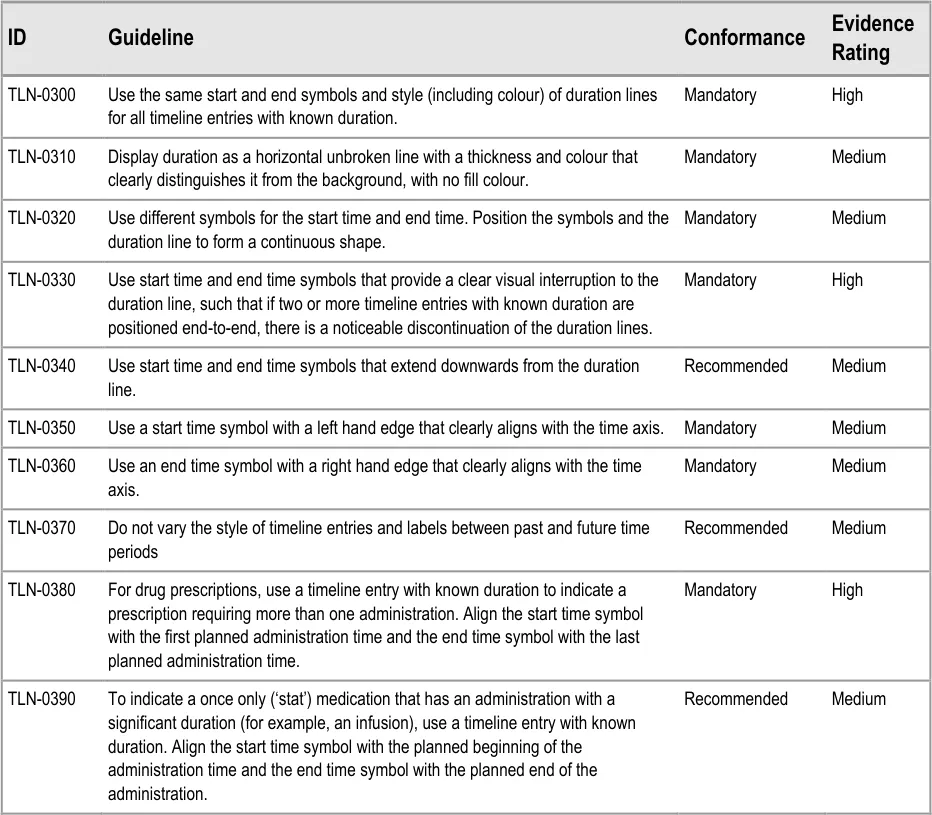
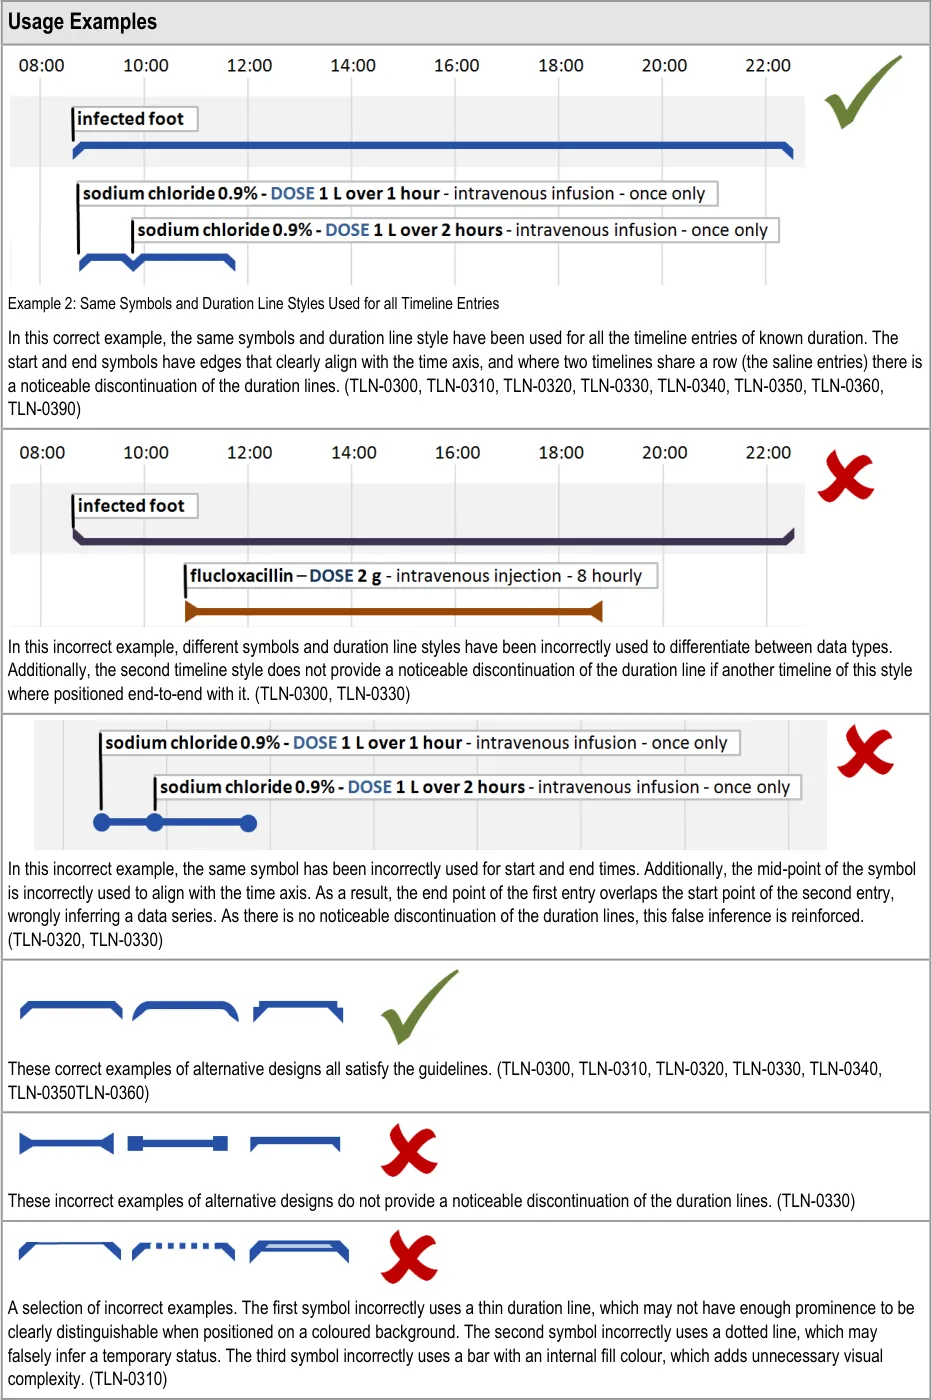
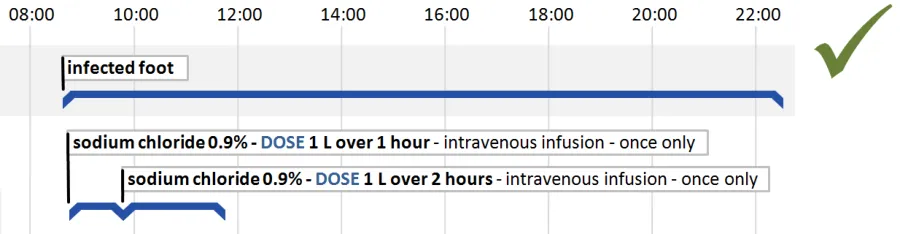
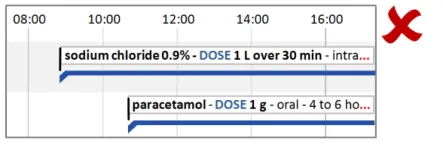
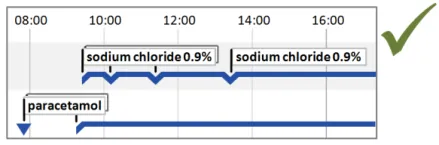
5.2.3 Timeline Entries with Known Duration
Many record entries have a period of validity determined by start and end times. Displaying entries with a known duration is one of the strengths of the timeline approach to data visualisation.
Examples are:
- Drug prescriptions that are for a defined period; for example, a prescription for an infusion
over 12 hours, or a seven day course of tablets
- Patient conditions that have been noted and then recorded as resolved; for example,
‘infected foot’
Page 24
Copyright ©2013 Health and Social Care Information Centre
HSCIC Controlled Document
Page 25
Copyright ©2013 Health and Social Care Information Centre
 HSCIC Controlled Document
Page 26
Copyright ©2013 Health and Social Care Information Centre
HSCIC Controlled Document
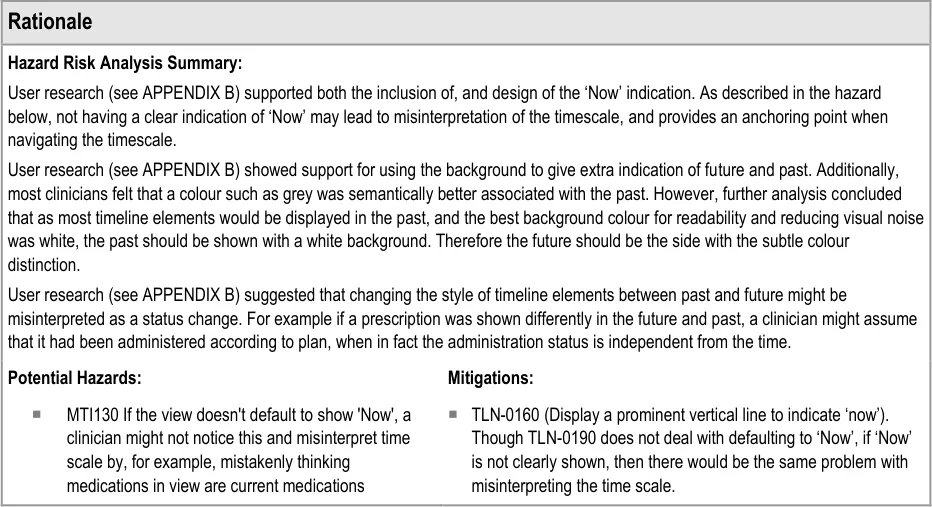
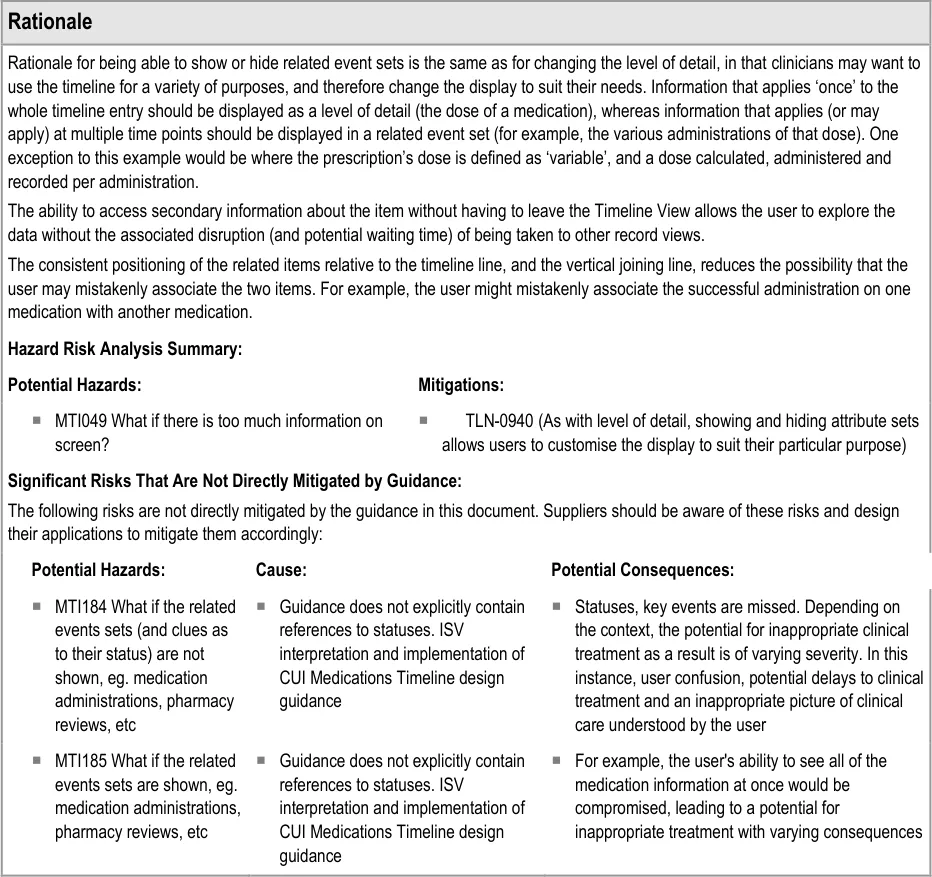
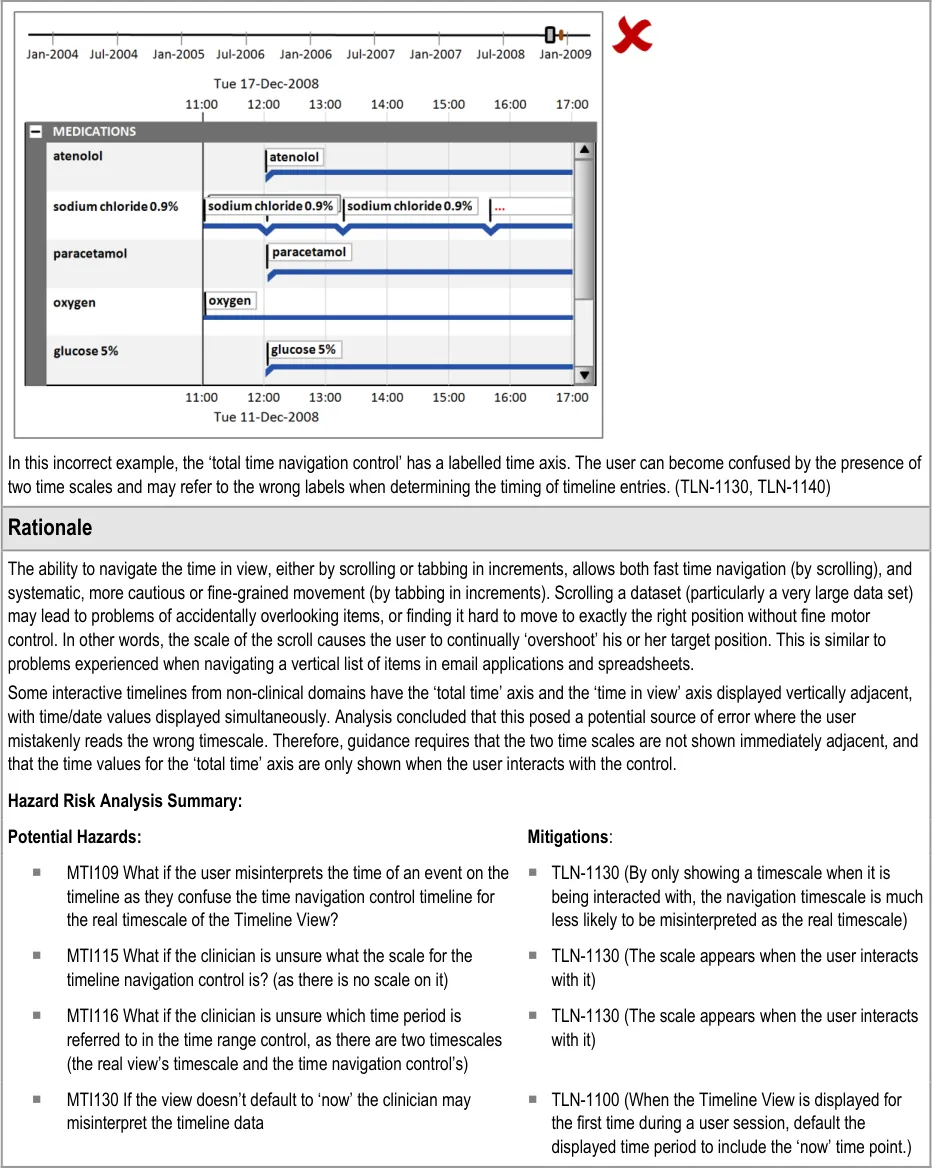
Hazard Risk Analysis Summary:
Potential Hazards: Mitigations :
MTI073 dashed line misinterpreted as something else, such as on / off
MTI079 Only ‘discrete’ items are displayed – no items with duration. Users forget that some events may imply a persistent condition (such as a diagnosis of asthma) and therefore do not factor in things like co-occurrence
MTI153 If you ‘mouse over’ a shared prescription start/end blob (that is, shares two durations) - which duration is highlighted?
MTI176 If two duration items one the same line have been stopped and started in quick succession (e.g. a medication dose is changed by stopping one and starting another) then it is quite likely that the two ‘blobs’ will occlude and so turn the ‘crowding’ UI on (which might make it harder to notice that items are separate?)
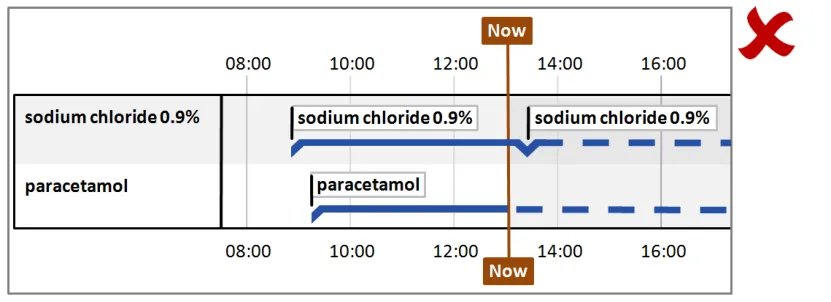
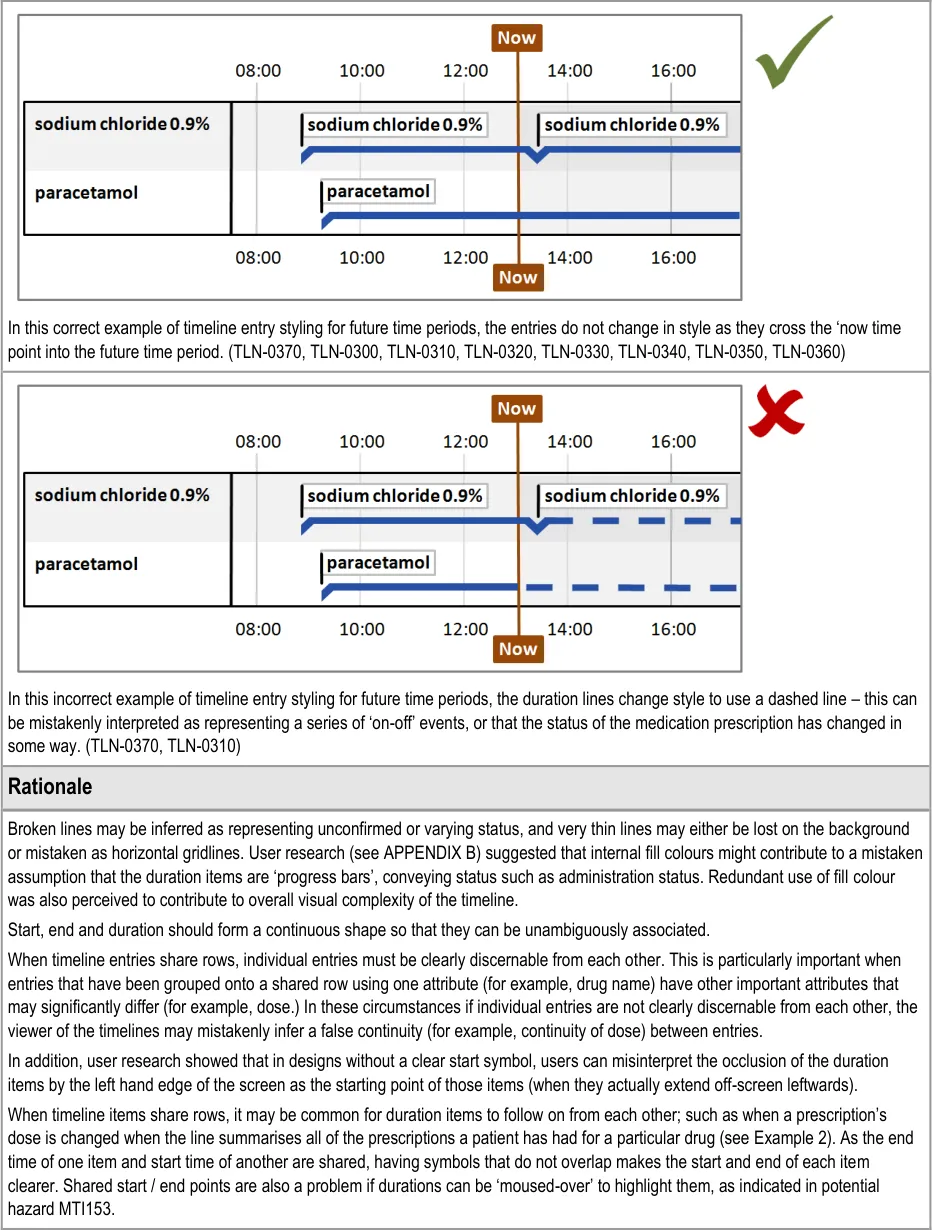
MTI072 User mistakenly thinks that past events HAVE occurred, or that future events WILL occur
MTI073 What if the dashed line (representing future items) is misinterpreted as something else, such as on / off?
MTI162 The clinician mistakenly assumes that the solid and dotted line on prescriptions refers to administration status
MTI163 The clinician is confused as to why the prescription line (a plan) changes to a dotted in the future as the PLAN to give it doesn’t change, and that it might (incorrectly) be seen as a status change (such as an administration status change)
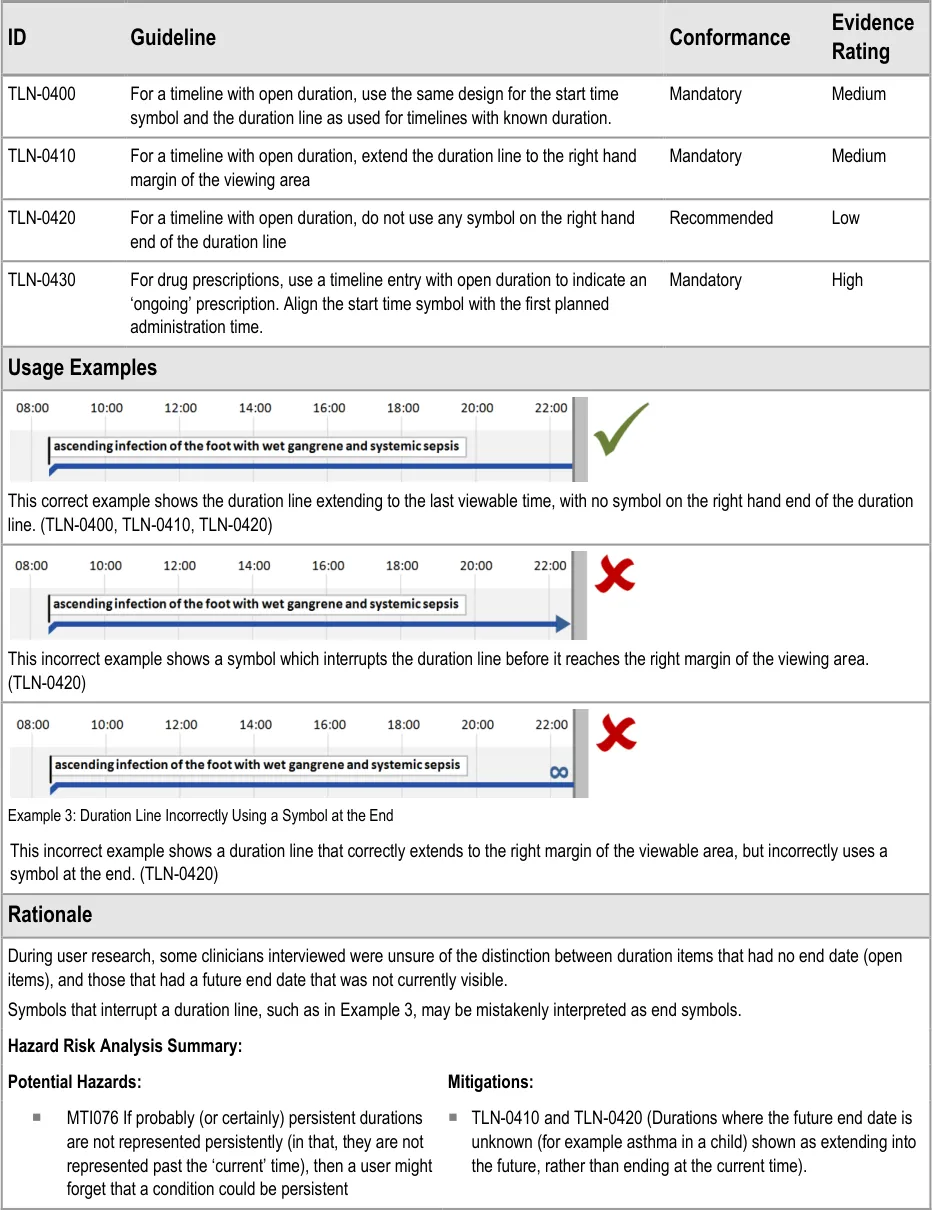
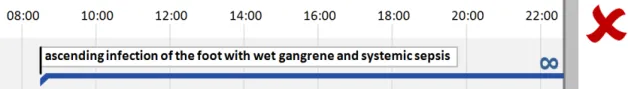
TLN-0300 (Display duration as a horizontal unbroken line with
a thickness and colour that clearly distinguishes it from the background., with no fill colour )
TLN-0300 (Display duration as a horizontal unbroken line with
a thickness and colour that clearly distinguishes it from the background with no fill colour). Risk is mitigated by displaying any items that have a duration
TLN-0350 (Use a start time symbol with a left hand edge that
clearly aligns with the time axis) and TLN-0350 (Use an end time symbol with a right hand edge that clearly aligns with the time axis)
TLN-0330, TLN-0350, TLN-0360 (Start and end items do not
occlude each other)
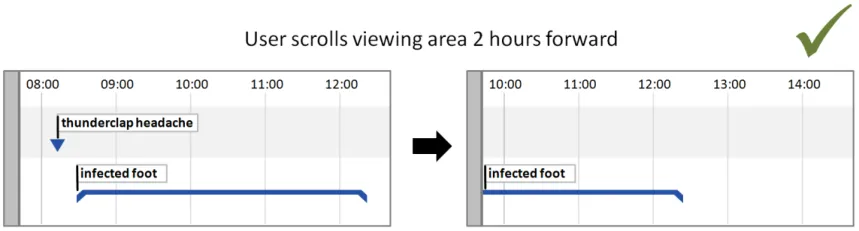
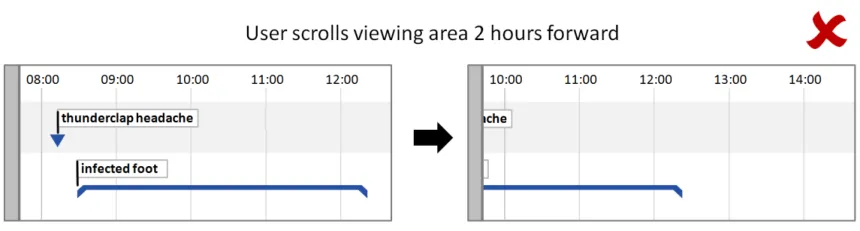
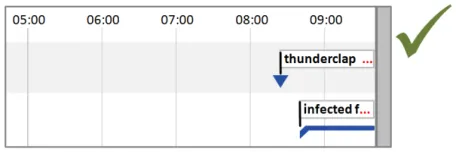
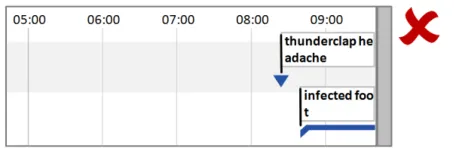
TLN-0370 (Do not vary the style of timeline entries and labels
between past and future time periods)
TLN-0370 (Do not vary the style of timeline entries and labels
between past and future time periods)
TLN-0370(Do not vary the style of timeline entries and labels
between past and future time periods)
TLN-0370 (Do not vary the style of timeline entries and labels
between past and future time periods)
5.2.4 Timeline Entries with Open Duration
Sometimes the end time of a timeline entry is unknown, indeterminate or infinite.
Examples are:
- Current medical conditions which may (or may not) be resolved at some undetermined
time in the future
-
Drugs prescribed on an ‘ongoing basis
-
Amputations or congenital conditions which the patient will have for the duration of their
life
Note
These examples, with the exception of amputations and congenital conditions, may be updated to timeline entries with known duration if end times are later provided. Therefore, there is a need to represent timeline entries with an open duration.
Page 27
Copyright ©2013 Health and Social Care Information Centre
HSCIC Controlled Document
Page 28
Copyright ©2013 Health and Social Care Information Centre
HSCIC Controlled Document
5.2.5 Timeline Entry Labels
Page 29
Copyright ©2013 Health and Social Care Information Centre
HSCIC Controlled Document
Page 30
Copyright ©2013 Health and Social Care Information Centre
 HSCIC Controlled Document
Page 31
Copyright ©2013 Health and Social Care Information Centre
 HSCIC Controlled Document
Page 32
Copyright ©2013 Health and Social Care Information Centre
 HSCIC Controlled Document
Page 33
Copyright ©2013 Health and Social Care Information Centre
HSCIC Controlled Document
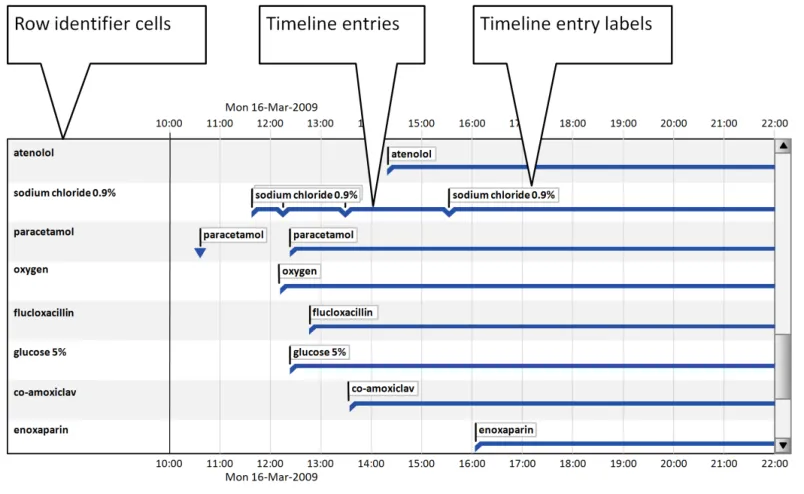
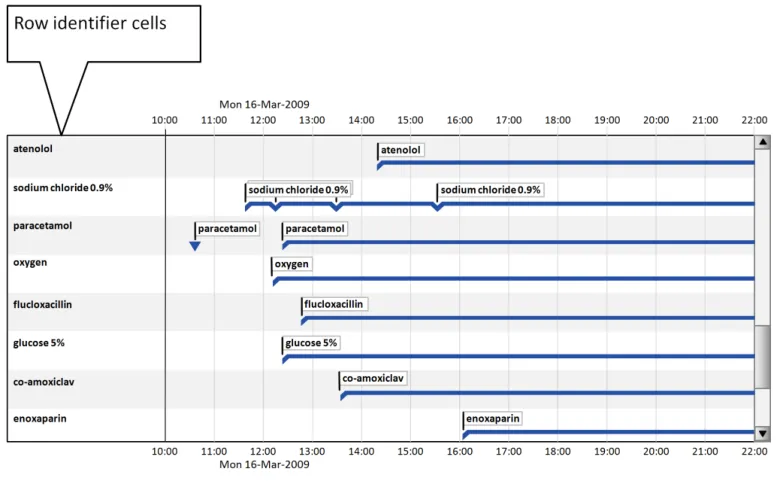
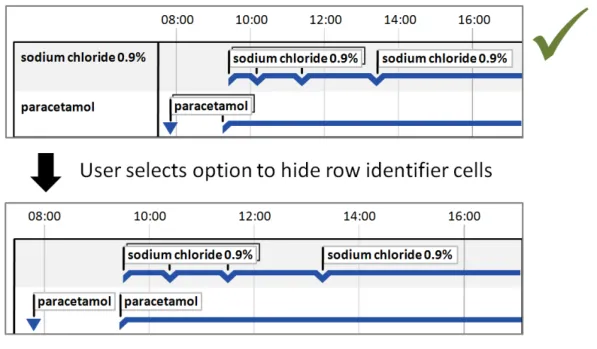
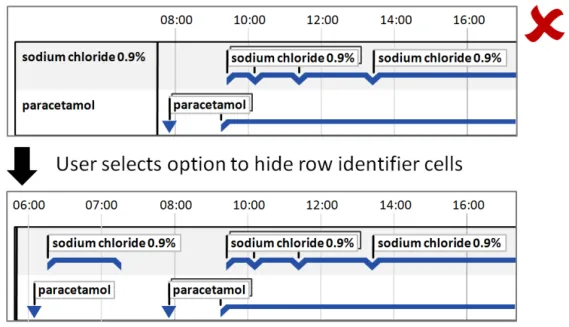
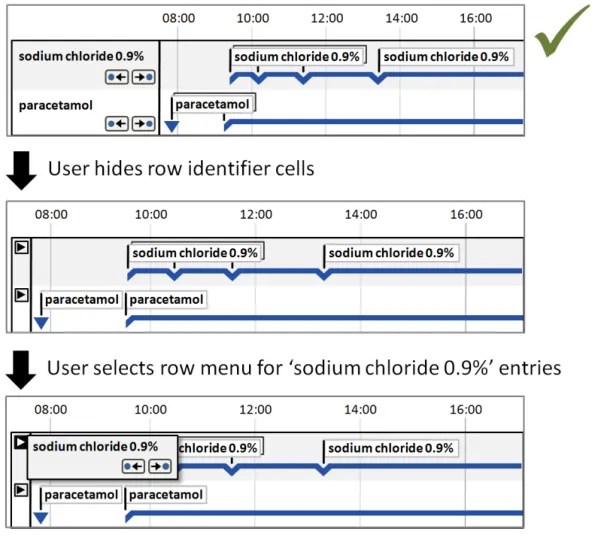
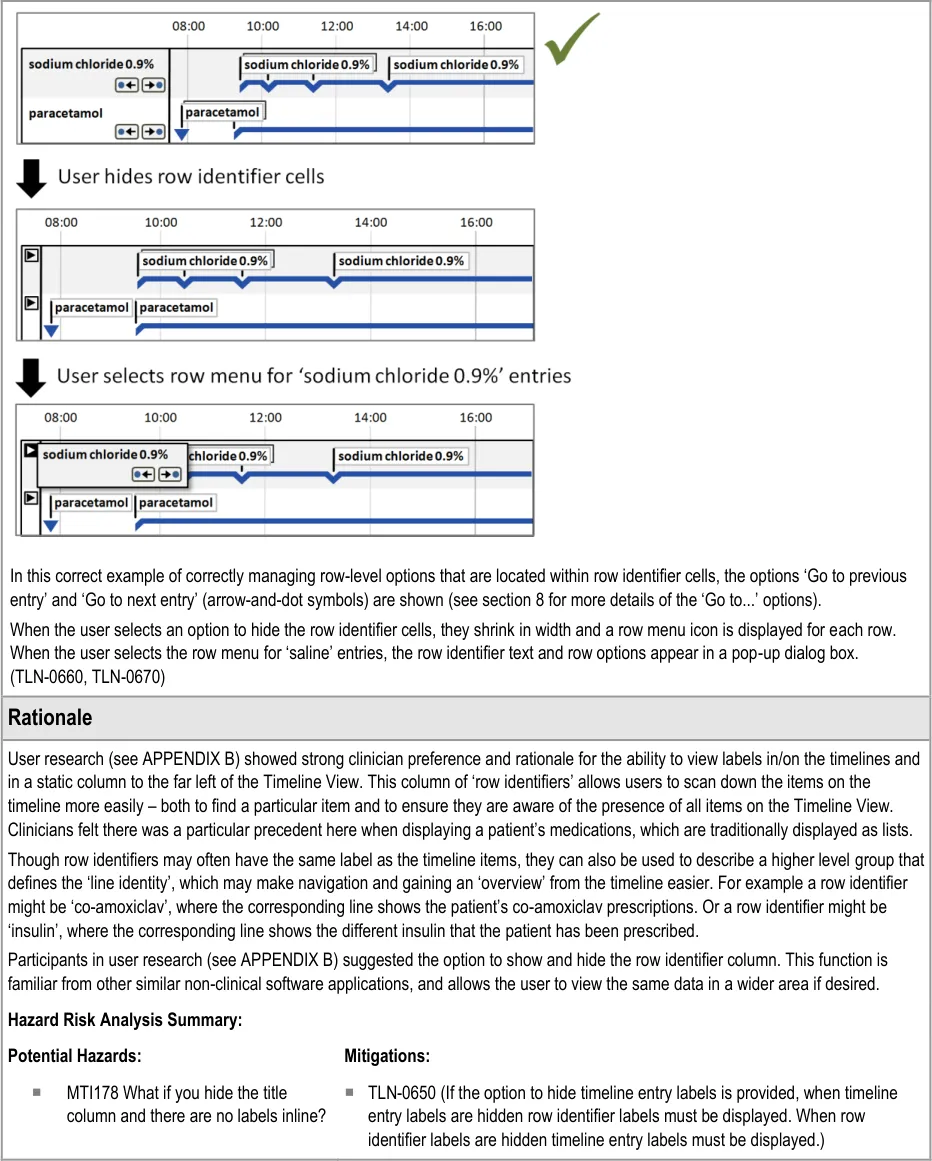
5.2.6 Row Identifier Cells
Additional to timeline labels, row identifier cells provide a means for the user to identify what is displayed in a row. This is particularly useful when, for the viewed time period, a row does not contain any timeline entries. Row identifier cells also provide the user a means for quickly assimilating the information that is being displayed. Figure 6 illustrates row identifier cells:
Figure 6: Row Identifier Cells
Page 34
Copyright ©2013 Health and Social Care Information Centre
HSCIC Controlled Document
Page 35
Copyright ©2013 Health and Social Care Information Centre
 HSCIC Controlled Document
Page 36
Copyright ©2013 Health and Social Care Information Centre
HSCIC Controlled Document
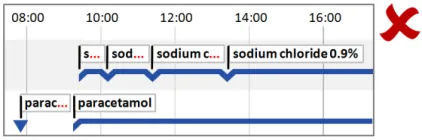
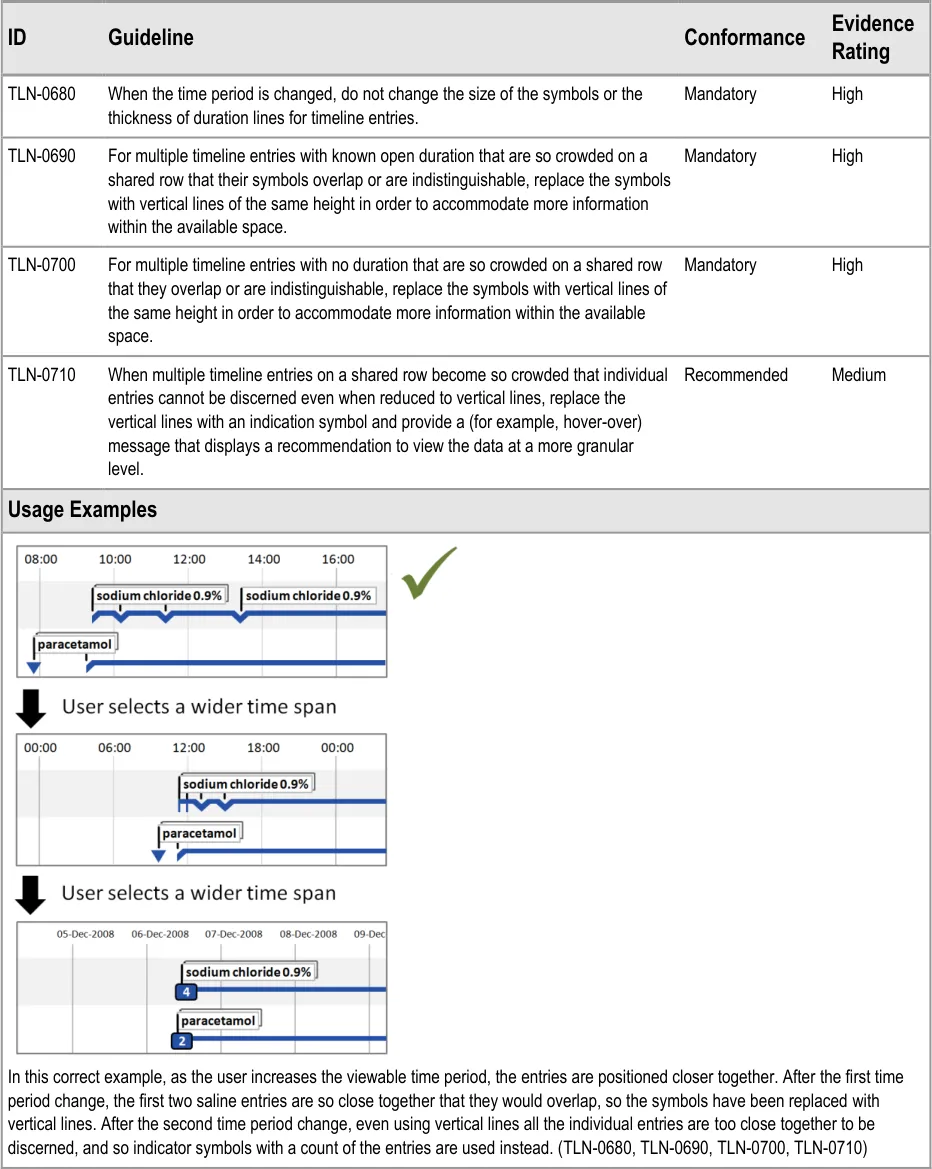
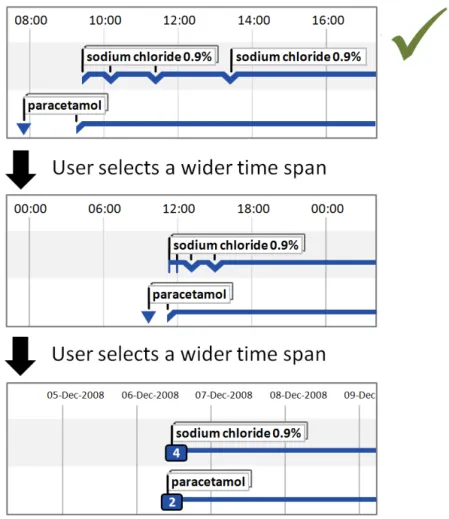
5.2.7 Displaying Crowded Timeline Entries and Labels
When multiple timeline entries are displayed on a shared row and the user chooses a greater time period, the entries will be displayed closer together. As the chosen time period is increased, it is highly likely that the entries will become crowded.
Page 37
Copyright ©2013 Health and Social Care Information Centre
HSCIC Controlled Document
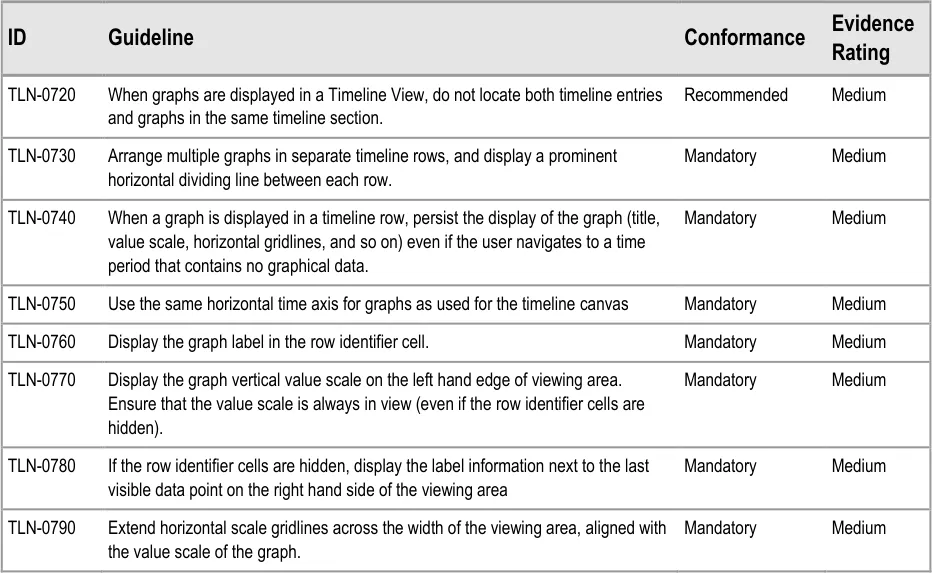
5.2.8 Displaying Graphs in Conjunction With a Timeline View
Some quantitative data is better represented as a graph (for example, observations such as temperature, blood pressure, and so on). These can be viewed in conjunction with a timeline representation of other data to provide comprehensive patient data visualisations.
Use the guidelines below in conjunction with the graph guidelines found in Displaying Graphs and Tables –User Interface Design Guidance {R5}.
Page 38
Copyright ©2013 Health and Social Care Information Centre
HSCIC Controlled Document
Page 39
Copyright ©2013 Health and Social Care Information Centre
HSCIC Controlled Document
Page 40
Copyright ©2013 Health and Social Care Information Centre
HSCIC Controlled Document
6 GUIDANCE DETAILS FOR NAVIGATING TIMELINE ENTRIES WITHIN A CHOSEN TIME PERIOD
6.1 Introduction
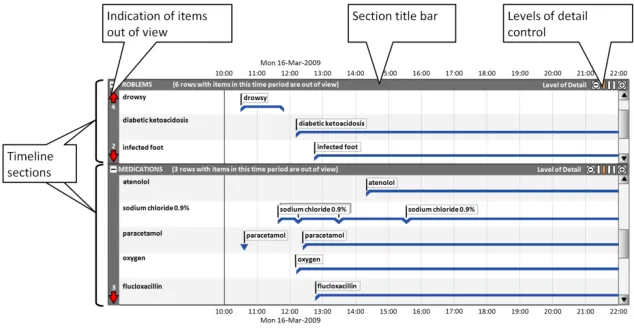
This part of the document includes guidance on using timeline sections to group entries, and covers the display of section title bars, indication of any timeline entries within the chosen period that are out of view, and controlling the level of detail displayed in each section. Figure 7 illustrates those features:
Figure 7: Timeline View Features Covered in this Section
6.2 Guidelines
6.2.1 Timeline Sections
Timeline sections provide a means of partitioning different information into related sets, giving users better control over what parts of the overall timeline canvas they can see at one time within the limitations of the display size.
Page 41
Copyright ©2013 Health and Social Care Information Centre
HSCIC Controlled Document
Page 42
Copyright ©2013 Health and Social Care Information Centre
 HSCIC Controlled Document
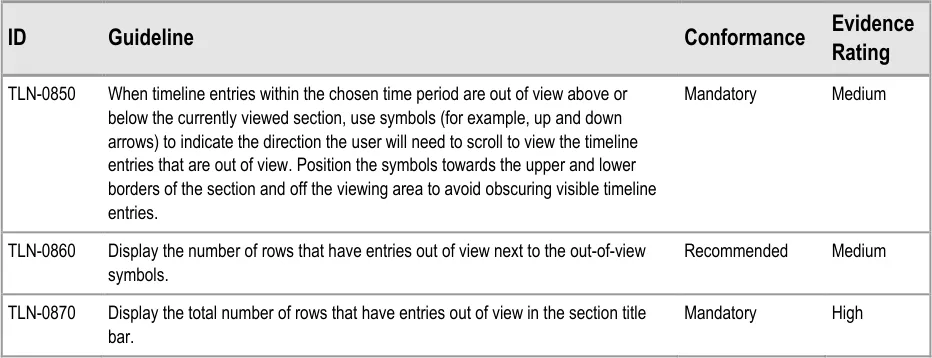
6.2.2 Indicating Timeline Entries Within the Chosen Time Period That Are Out of View
Page 43
Copyright ©2013 Health and Social Care Information Centre
HSCIC Controlled Document
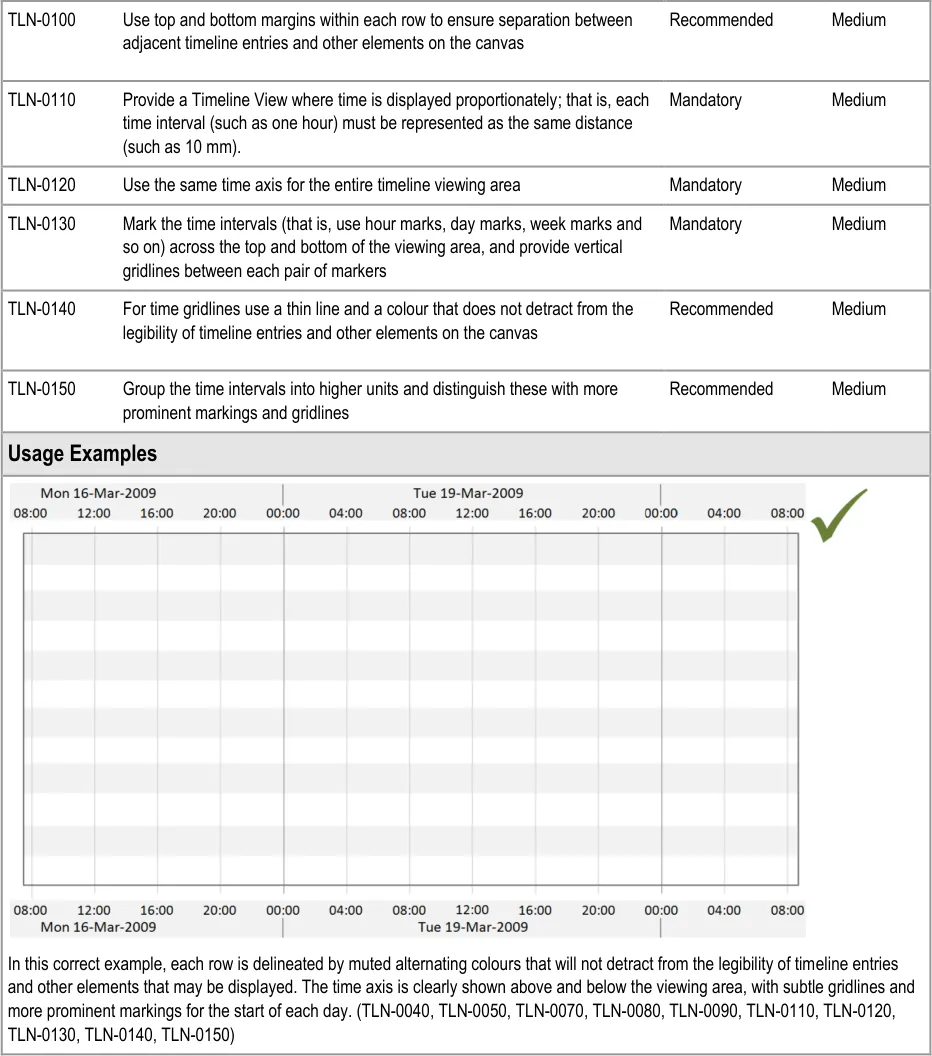
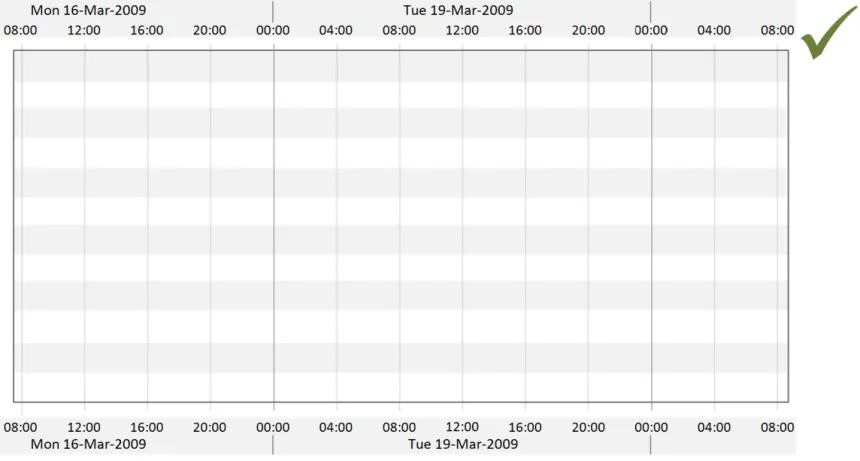
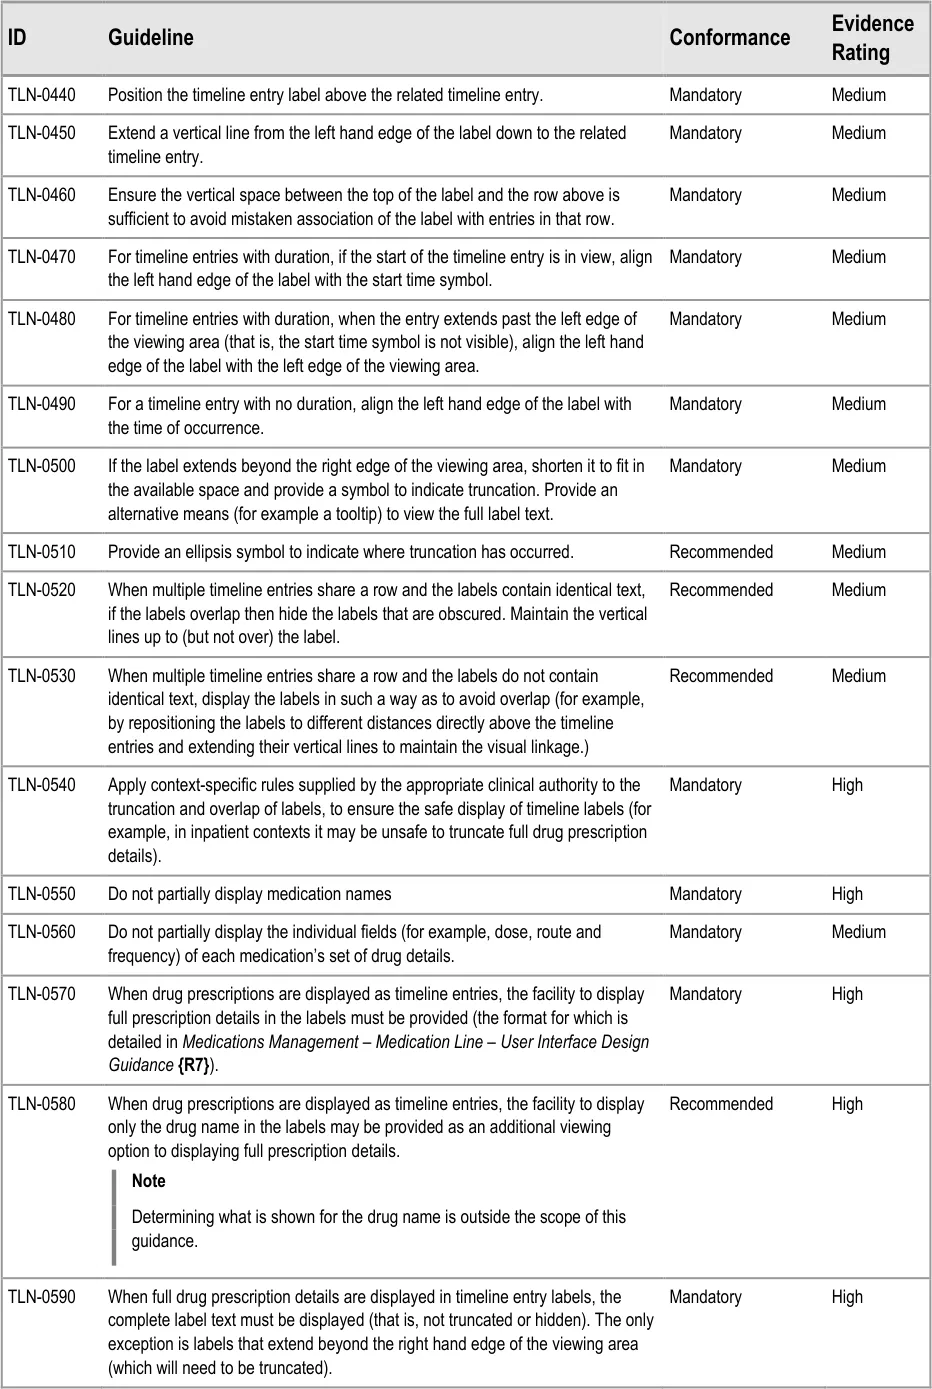
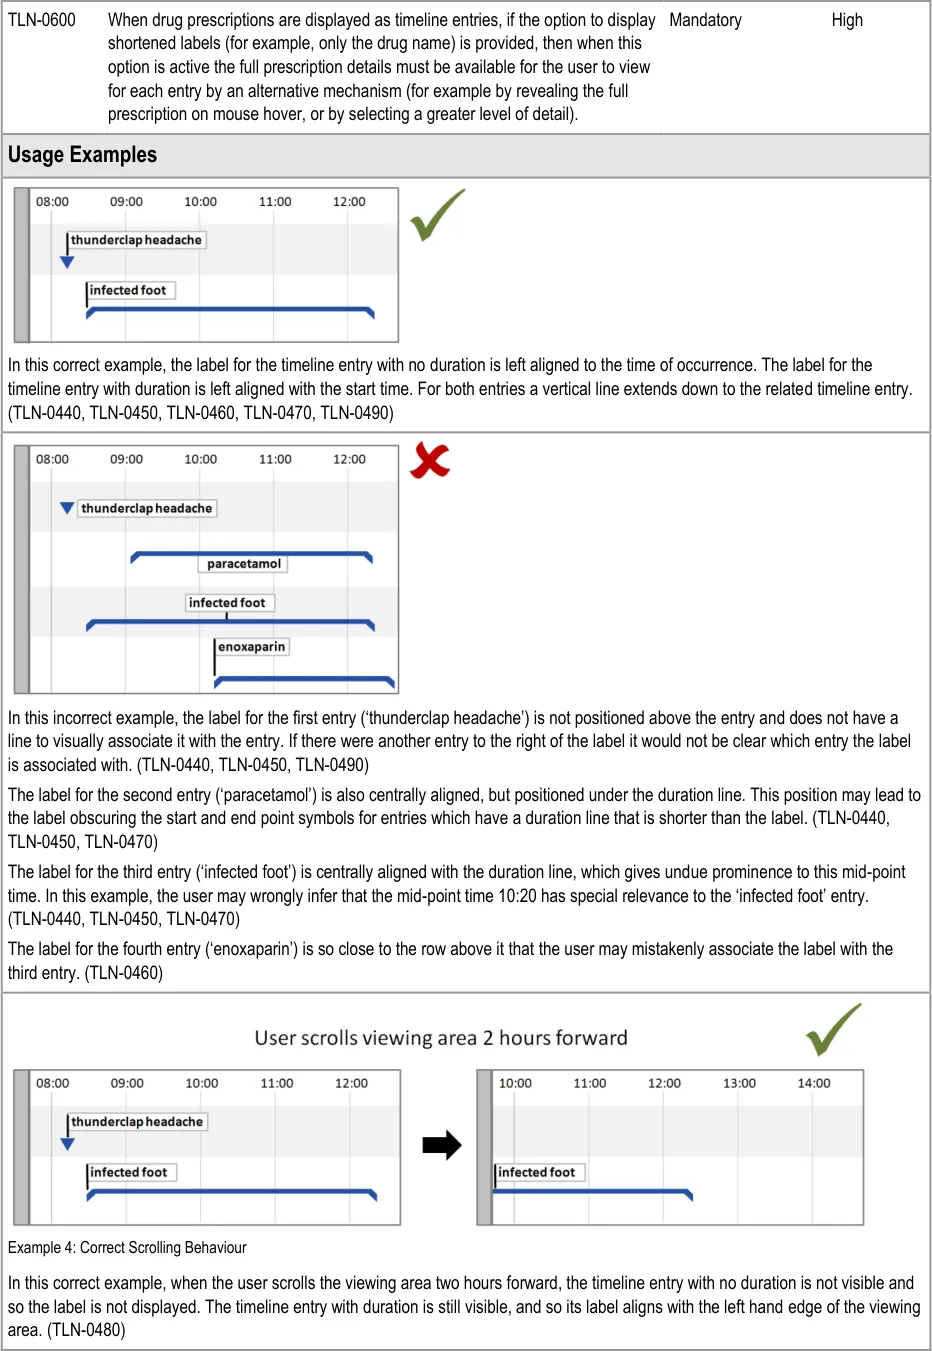
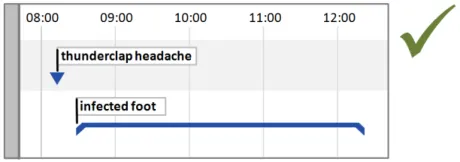
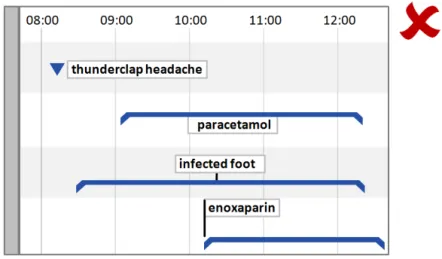
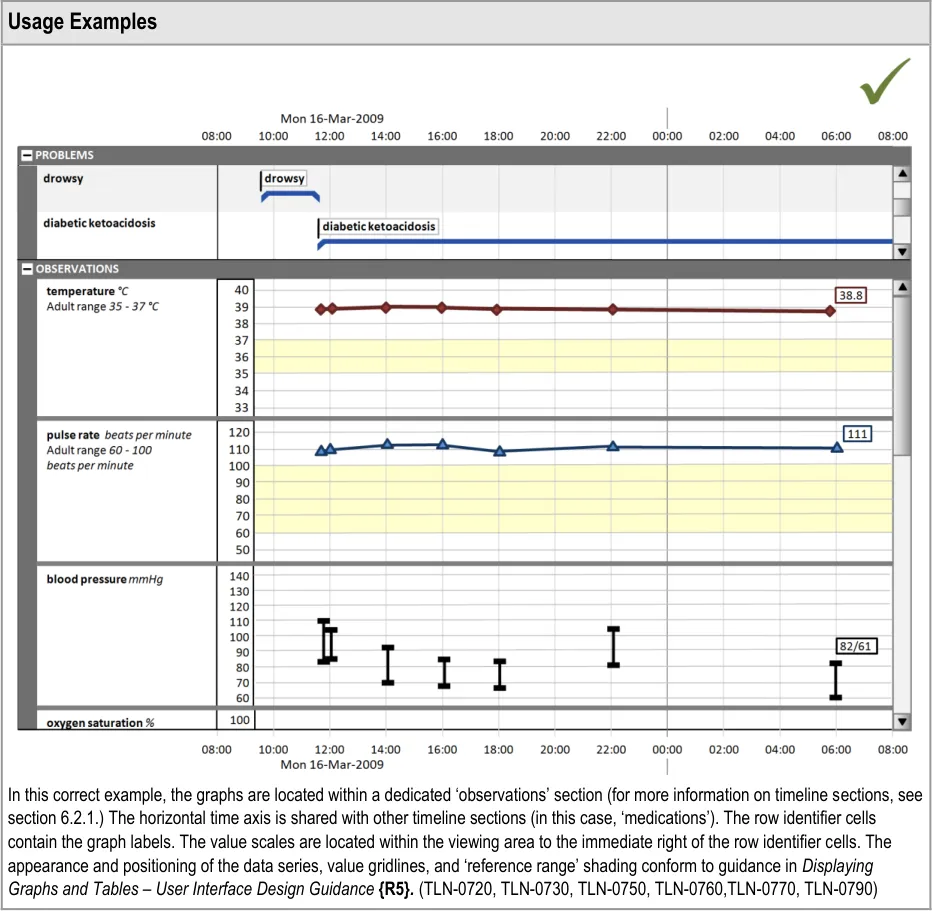
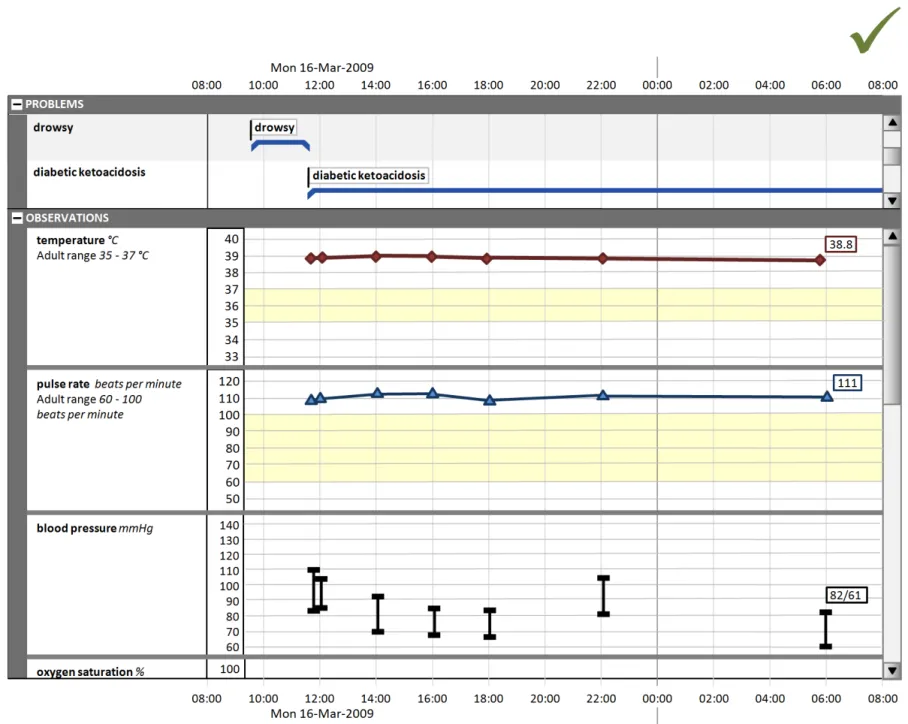
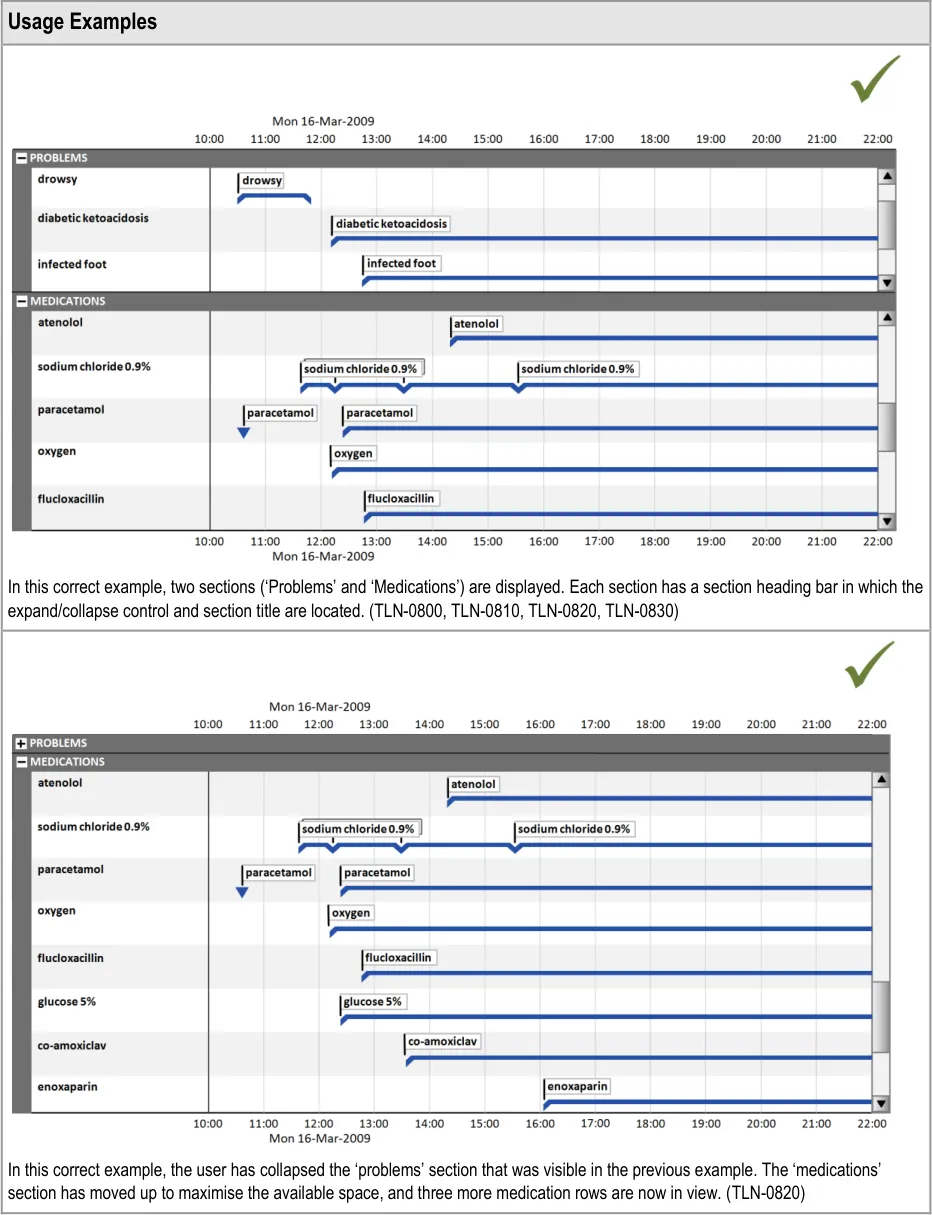
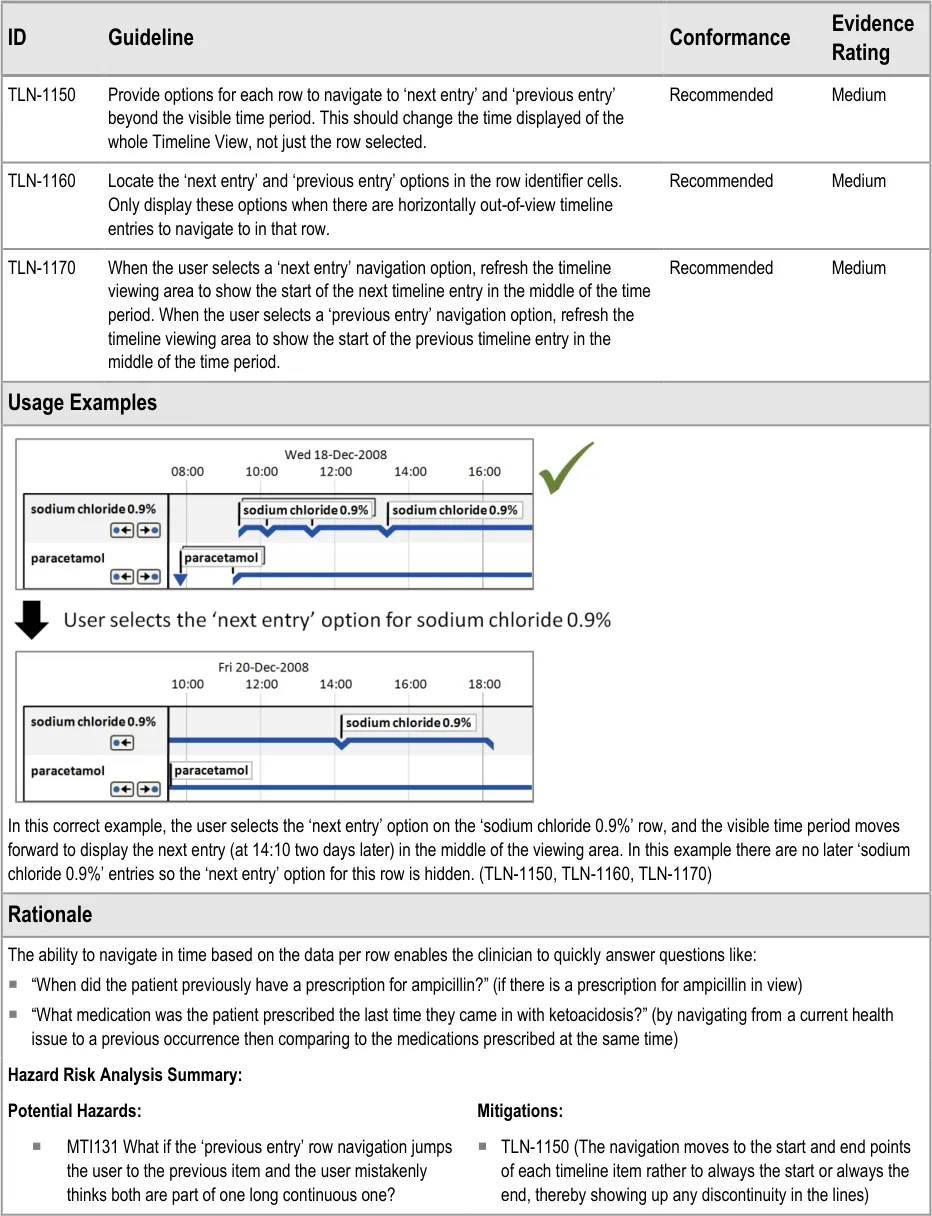
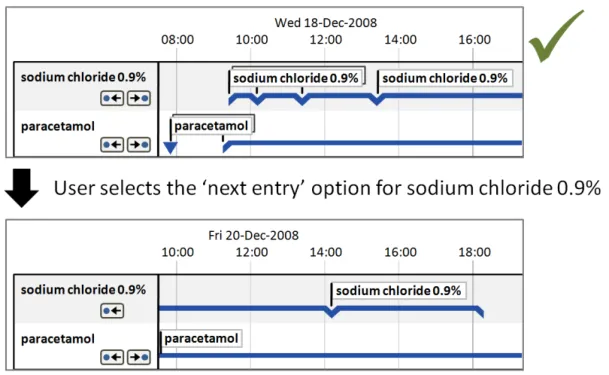
| Col1 | Usage Examples |
|---|---|
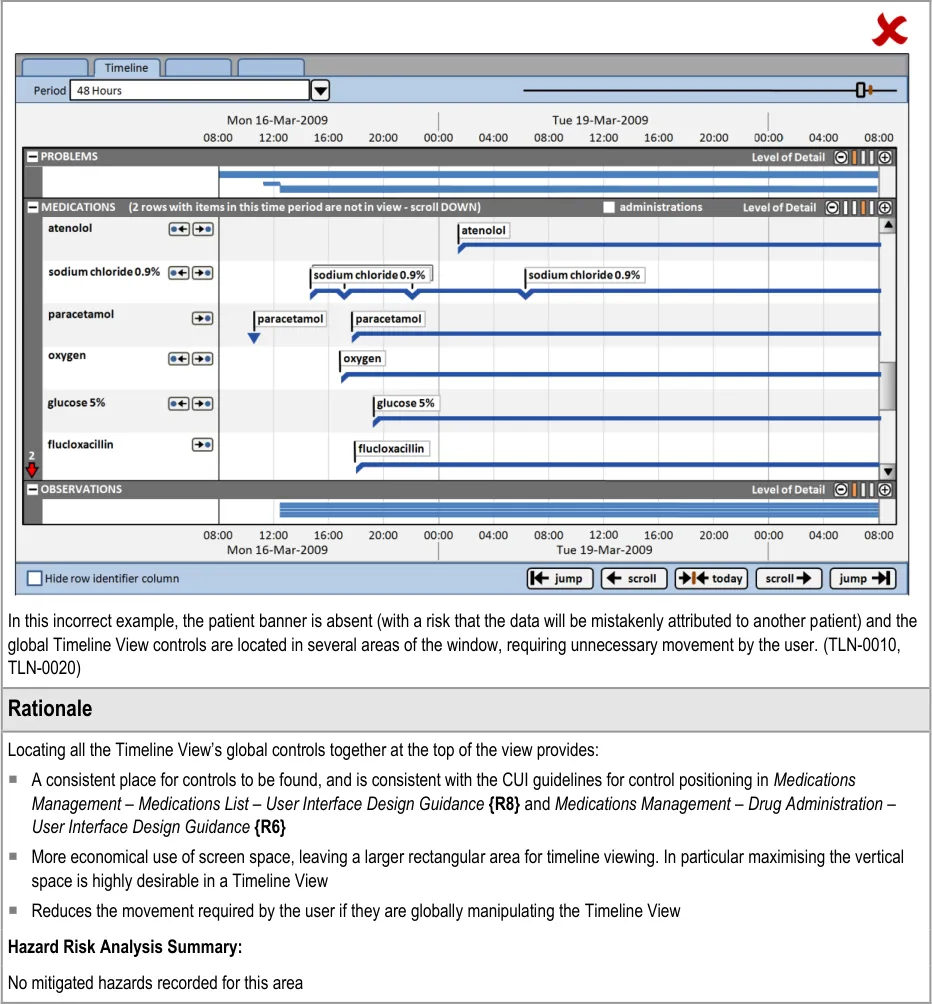
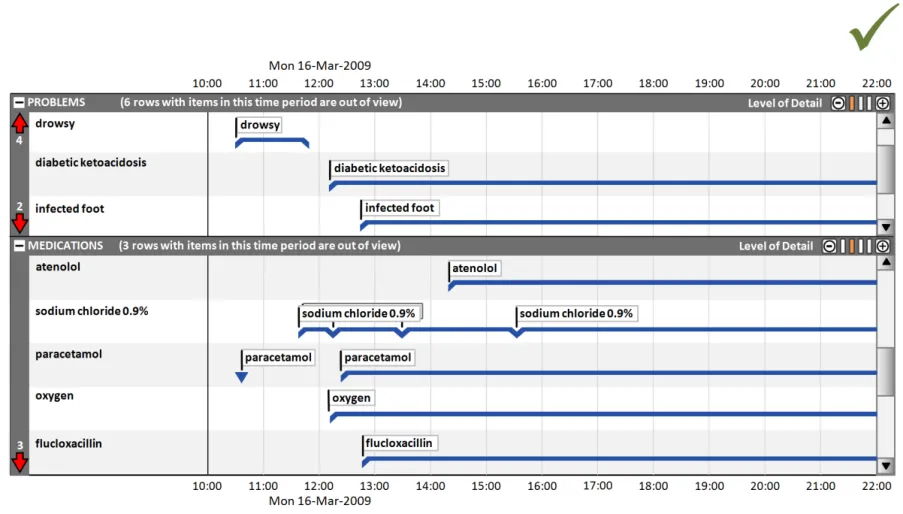
In this correct example, in the ‘problems’ section, the out-of-view arrow symbols indicate that there are four rows above and two rows below the current viewing area that have timeline items in the chosen time period. In the ‘medications’ section the out-of-view arrow symbols indicate that there are three rows below the current viewing area that have timeline items in the chosen time period. The text in each section title bar reinforces the out-of-view indicators. (TLN-0850, TLN-0860, TLN-0870) | |
| Rationale | |
| Given the large amount of data that will be available and the relatively small screen spaces of normal desktop monitors, it will be common to have more data to display vertically than space allows. Previous CUI work (Medications Management – Medications List – User Interface Design Guidance{R8}) concluded that in certain circumstances (such as for a list of medications), a scroll bar is not sufficient indication that data is out of view. The indicators provide a supplementary indication that data is out of view, positioned at the opposite side of the screen to the scroll bar, near to a user’s vertical scan line down the row identifier column. The indicator differs from the look-ahead examples in_Medications Management – Medications List – User Interface Design_ Guidance {R8} because: Summarising entries that are out of view in a horizontal line (such as a list of drug names) is likely to be impractical for many data sets in a Timeline View as they will potentially have hundreds of line items. These items also may not be able to be summarised safely The medications look-ahead indicator only operates on one list in a view, so it only takes up a maximum of two lines of vertical space (at the top and the bottom of the scrollbar). The Timeline View may have many sections, most of which may have data vertically out of view. If each also had two extra lines of ‘data out of view’ indicators this would take up a lot of vertical space and further interrupt the vertical scanning of the view. As described in TLN-0840 the timeline indicator already has a means to interrupt a user’s vertical scan and alert them to the presence of out of view items Displaying a count of entries out of view is consistent with_Medications Management – Medications List – User Interface Design_ Guidance {R8}. An indication that extends horizontally across the view is more likely to be noticed when user’s are scanning down the middle section of the view, and as such is also consistent with the risk mitigation behind the_Medications Management – Medications List – User_ Interface Design Guidance {R8}. Hazard Risk Analysis Summary: Potential Hazards: Mitigations: MTI068 User is not aware that data is contained within a category (as it is scrolled out of view) TLN-0850, TLN-0860, TLN-0870 (Indicating timeline entries within the chosen time period that are out of view) |
Page 44
Copyright ©2013 Health and Social Care Information Centre
HSCIC Controlled Document
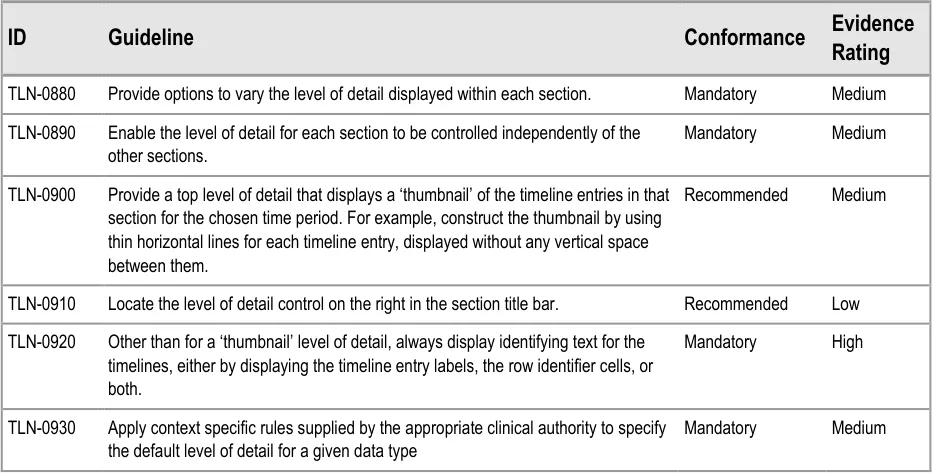
6.2.3 Timeline Section Levels of Detail
Clinicians can make best use of the viewing space available for their task when they can control the level of detail displayed in each timeline section.
For example, clinicians may wish to compare a medication’s dose changes (requiring a high level of detail for the ‘medications’ section) with the patient’s health issues (viewable at a lower level of detail for the ‘problems’ section).
Page 45
Copyright ©2013 Health and Social Care Information Centre
HSCIC Controlled Document
Page 46
Copyright ©2013 Health and Social Care Information Centre
HSCIC Controlled Document
Page 47
Copyright ©2013 Health and Social Care Information Centre
HSCIC Controlled Document
7 GUIDANCE DETAILS FOR DISPLAYING SETS OF RELATED EVENTS
7.1 Introduction
This section provides guidance on the positioning and appearance of sets of events related to timeline entries, including multiple sets.
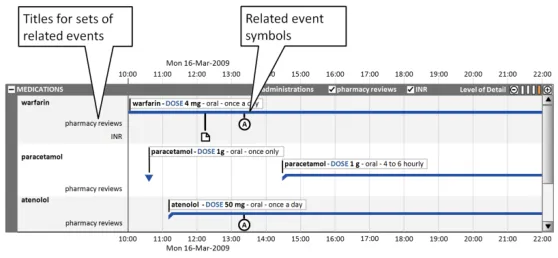
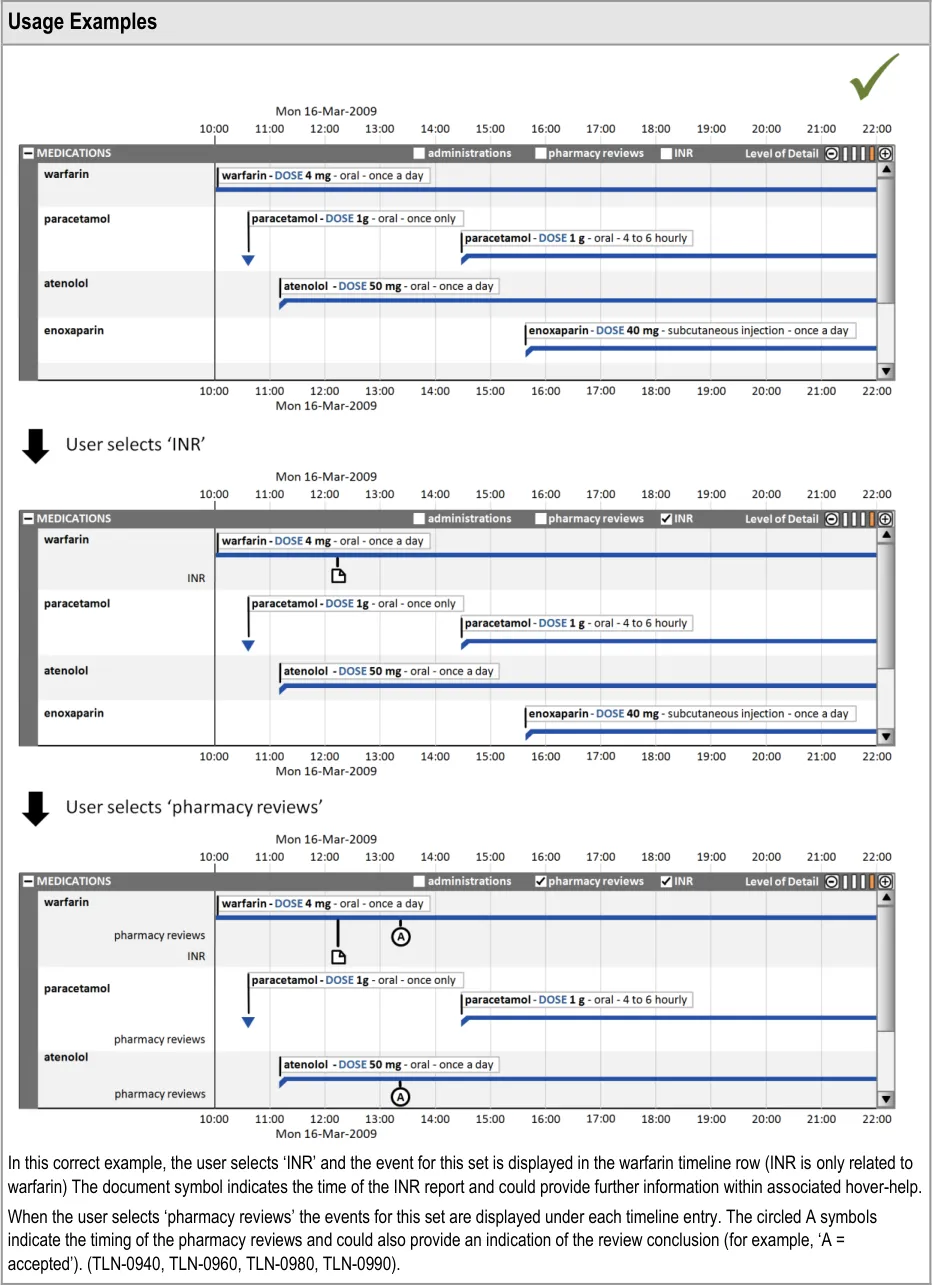
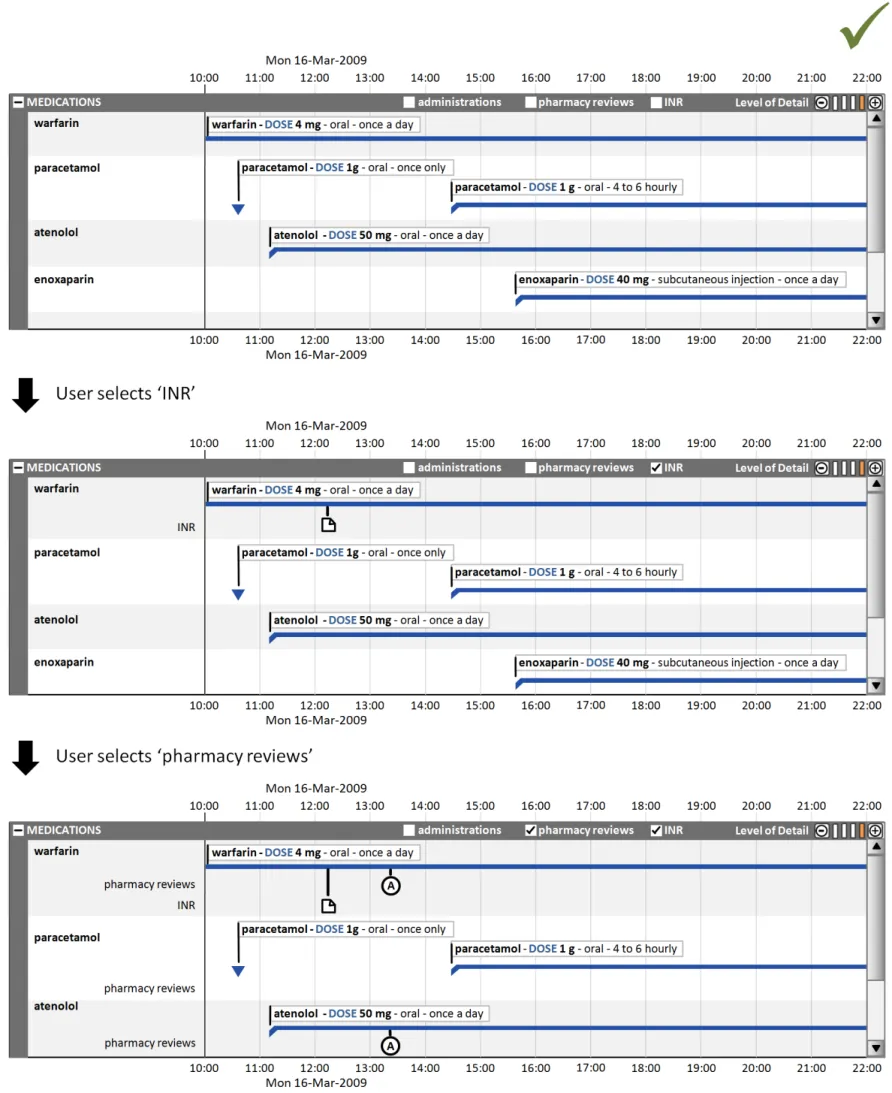
Often, information related to timeline entries is usefully represented as a set of related events. Figure 8 illustrates how, for medications, three sets of events could be visualised:
-
Administrations
-
Pharmacy reviews
-
International Normalised Ratio (INR) results
By having access to these additional layers of information, the clinician can review the sequence of events and explore potential cause-effect relationships at a more granular level.
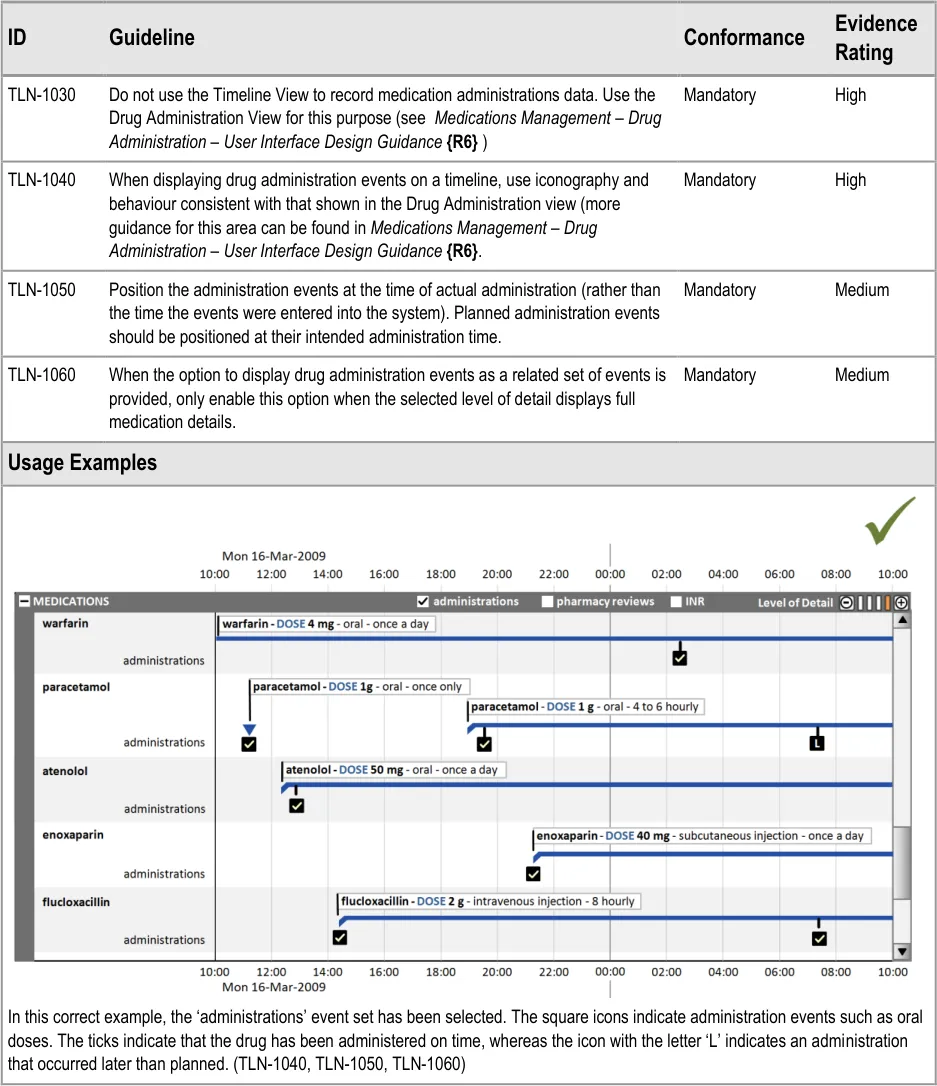
Figure 8: Visualisation of Three Sets of Events for Medications
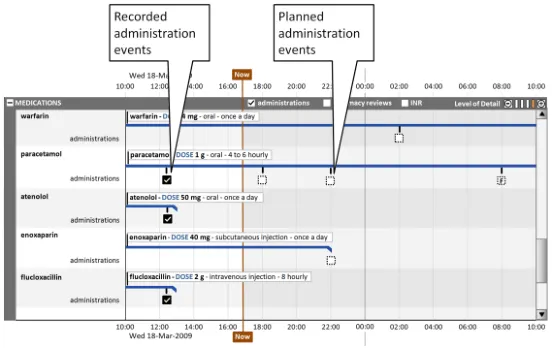
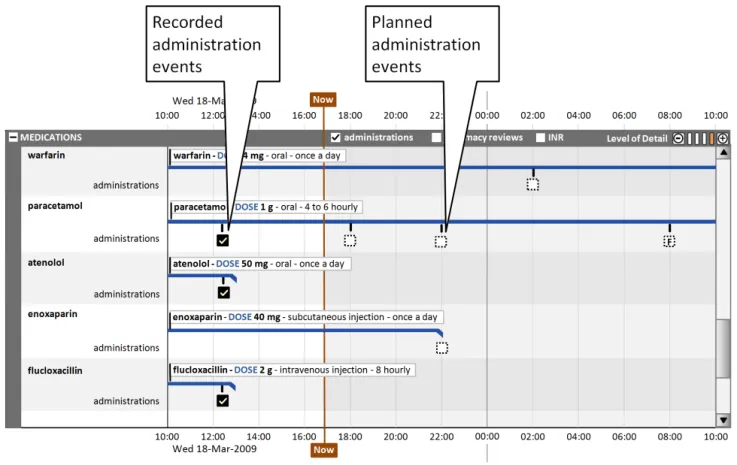
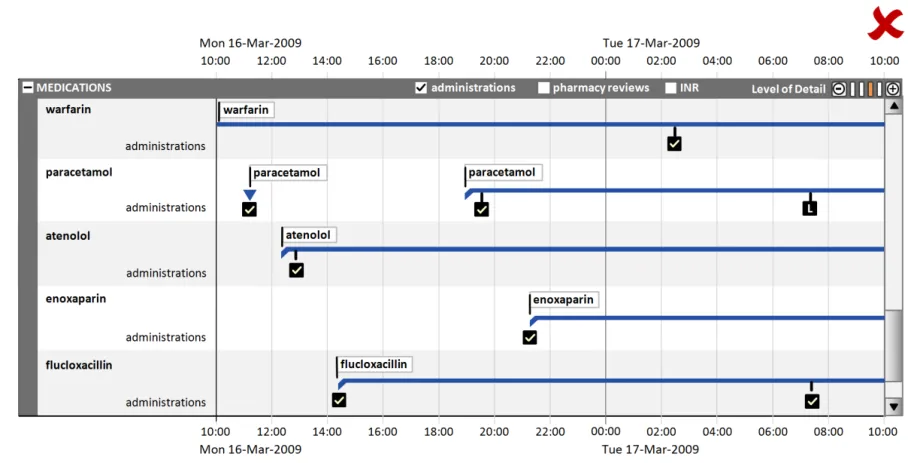
This section also covers the display of drug administration status as a related attribute set, as shown in Figure 9:
Page 48
Copyright ©2013 Health and Social Care Information Centre

 HSCIC Controlled Document
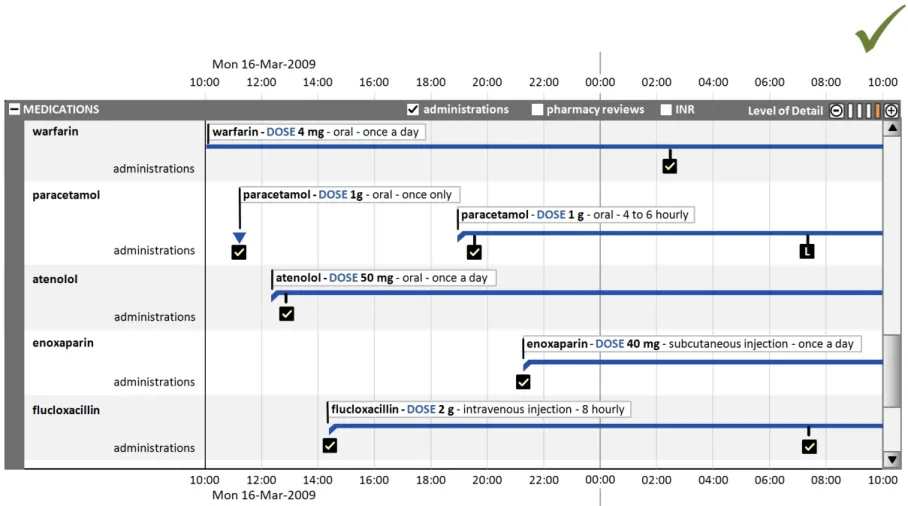
Figure 9: Display of Drug Administration Status as a Related Attribute Set
7.2 Guidelines
7.2.1 Displaying Related Events
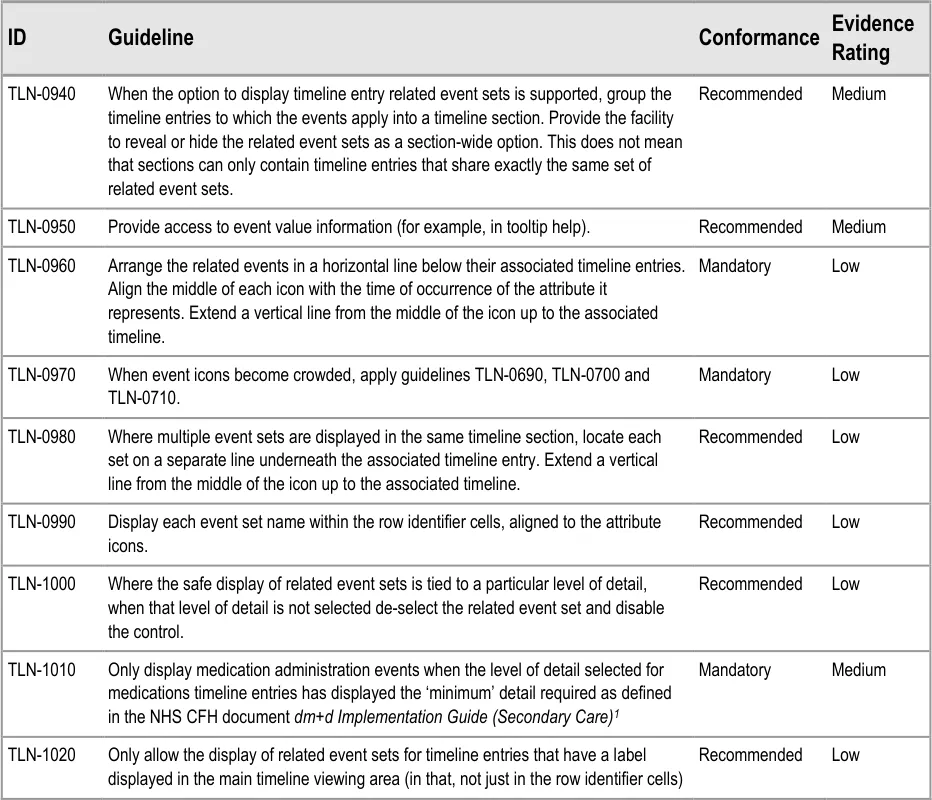
1 NHS CFH – dm+d Implementation Guide (Secondary Care) {R16} : http://www.connectingforhealth.nhs.uk/systemsandservices/eprescribing/refdocs
Page 49
Copyright ©2013 Health and Social Care Information Centre
HSCIC Controlled Document
Page 50
Copyright ©2013 Health and Social Care Information Centre
HSCIC Controlled Document
Page 51
Copyright ©2013 Health and Social Care Information Centre
HSCIC Controlled Document
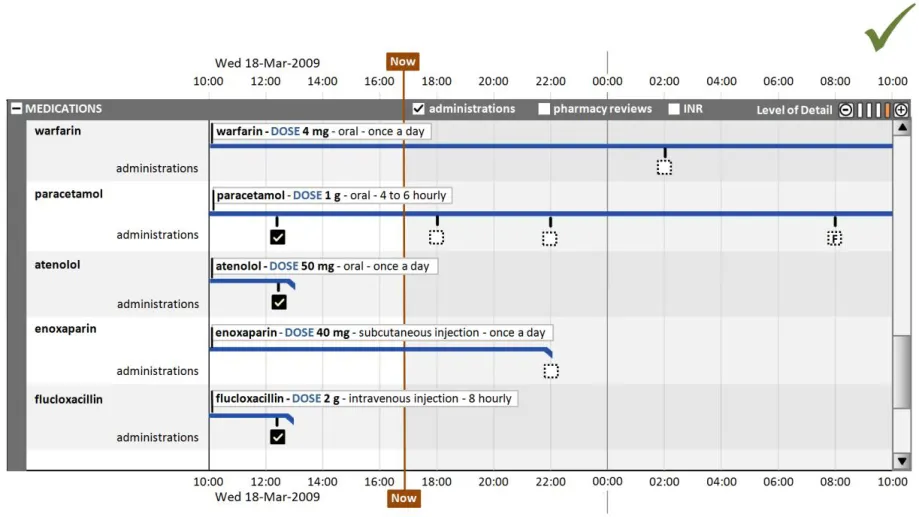
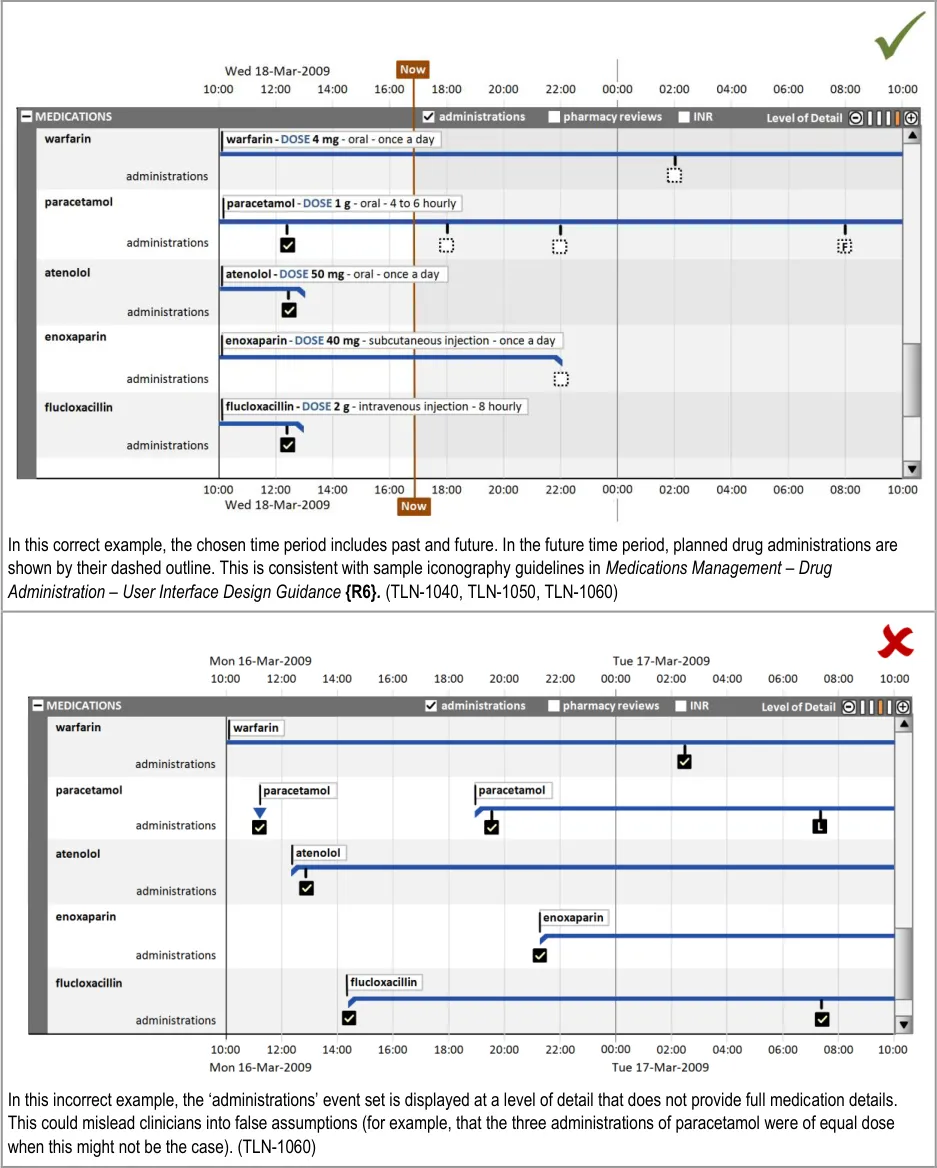
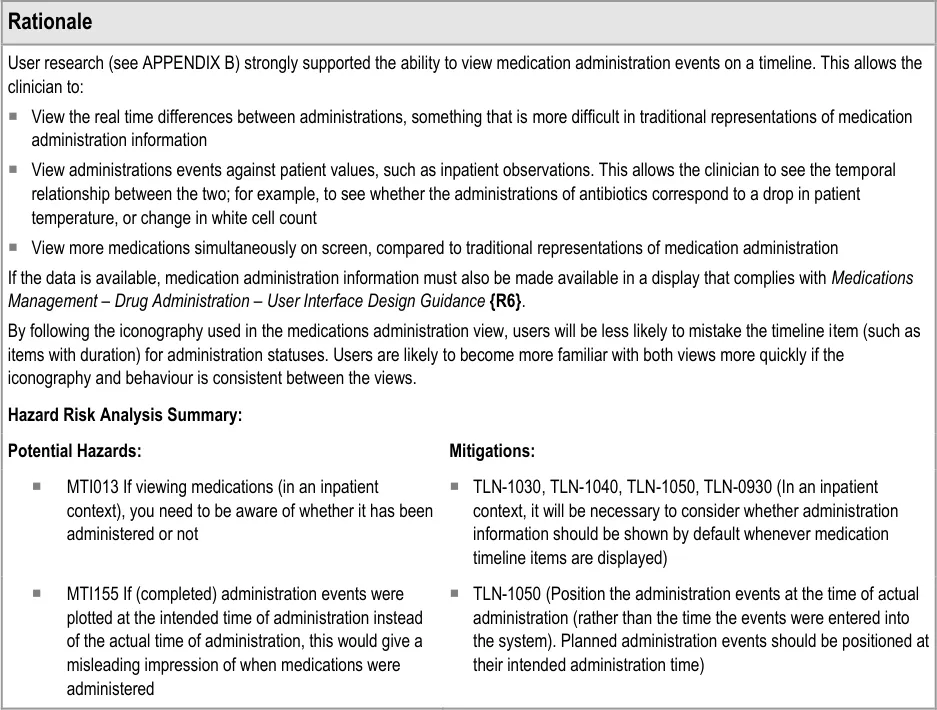
7.2.2 Displaying Drug Administration Information As a Related Set of Events
Page 52
Copyright ©2013 Health and Social Care Information Centre
HSCIC Controlled Document
Page 53
Copyright ©2013 Health and Social Care Information Centre
 HSCIC Controlled Document
Page 54
Copyright ©2013 Health and Social Care Information Centre
HSCIC Controlled Document
8 GUIDANCE DETAILS FOR NAVIGATING TIME
8.1 Introduction
This section contains guidance for adjusting the time range displayed in the timeline viewing area and navigating across the total time range
Whereas previous sections of this document have provided guidance on how to best display and navigate timeline entries for a selected time period, this section considers navigation across the total time period that is available for display.
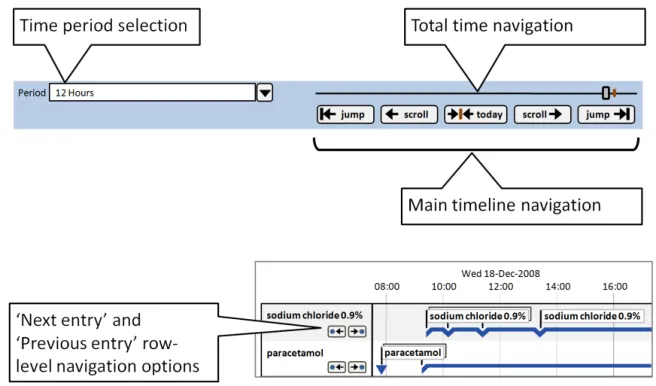
This guidance covers the selection of the viewed time range, navigation to time periods adjacent to the current time period and larger scale navigation to time points throughout the total time period. Figure 10 illustrates those features:
Figure 10: Timeline View Features Covered in this Section
8.2 Guidelines
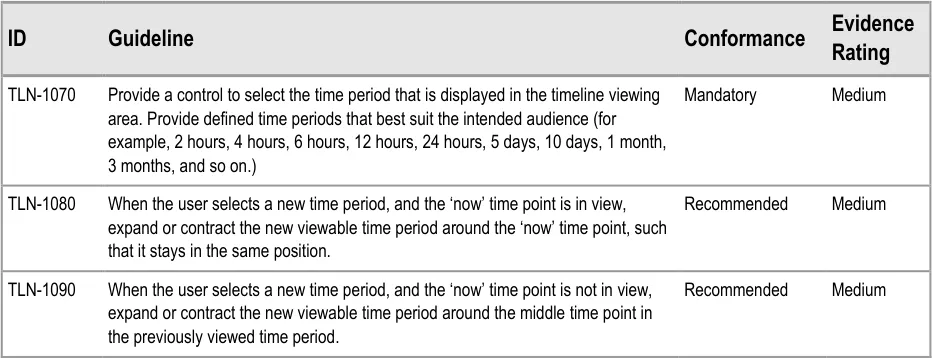
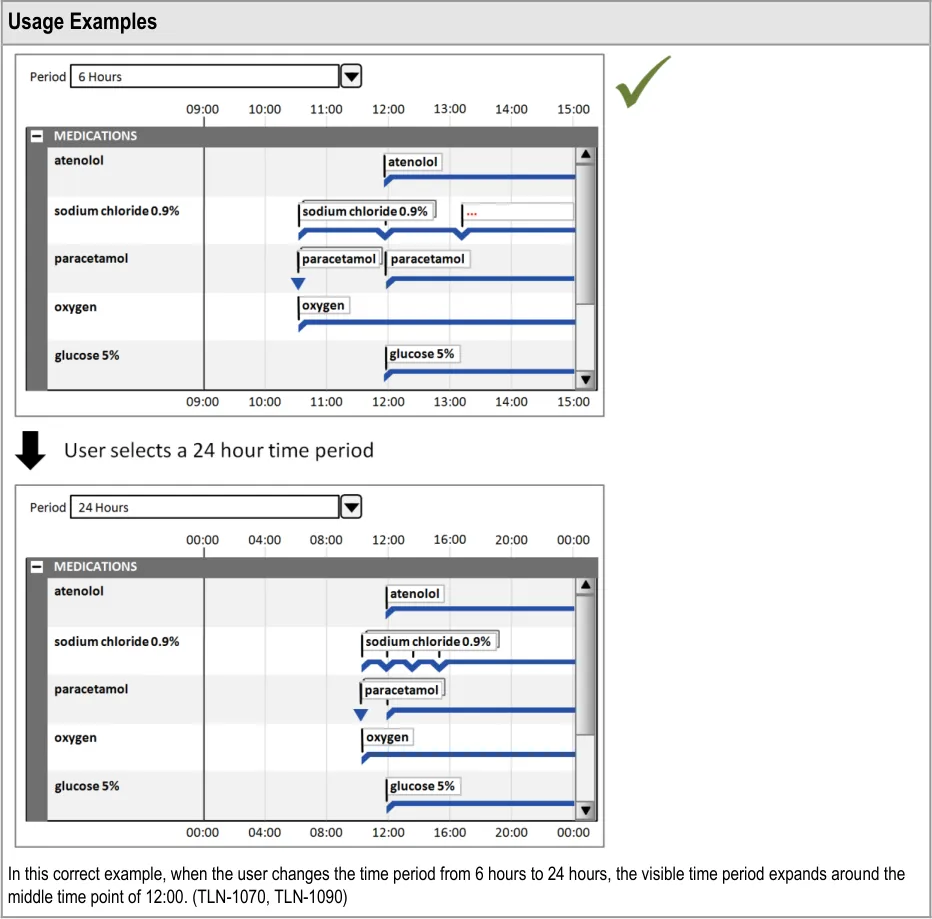
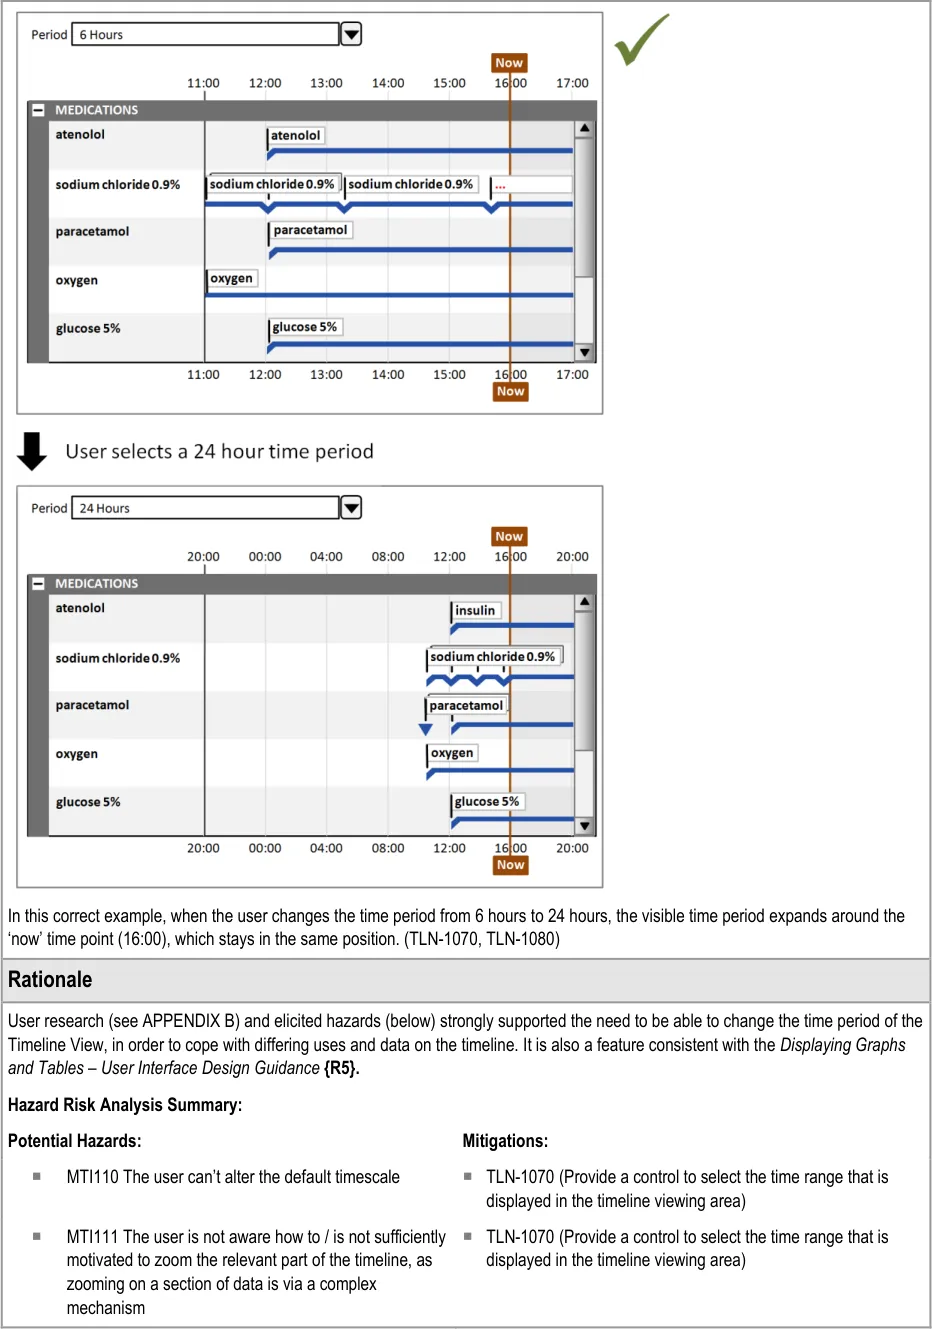
8.2.1 Adjusting the Viewed Time Period
Page 55
Copyright ©2013 Health and Social Care Information Centre
HSCIC Controlled Document
Page 56
Copyright ©2013 Health and Social Care Information Centre
HSCIC Controlled Document
Page 57
Copyright ©2013 Health and Social Care Information Centre
HSCIC Controlled Document
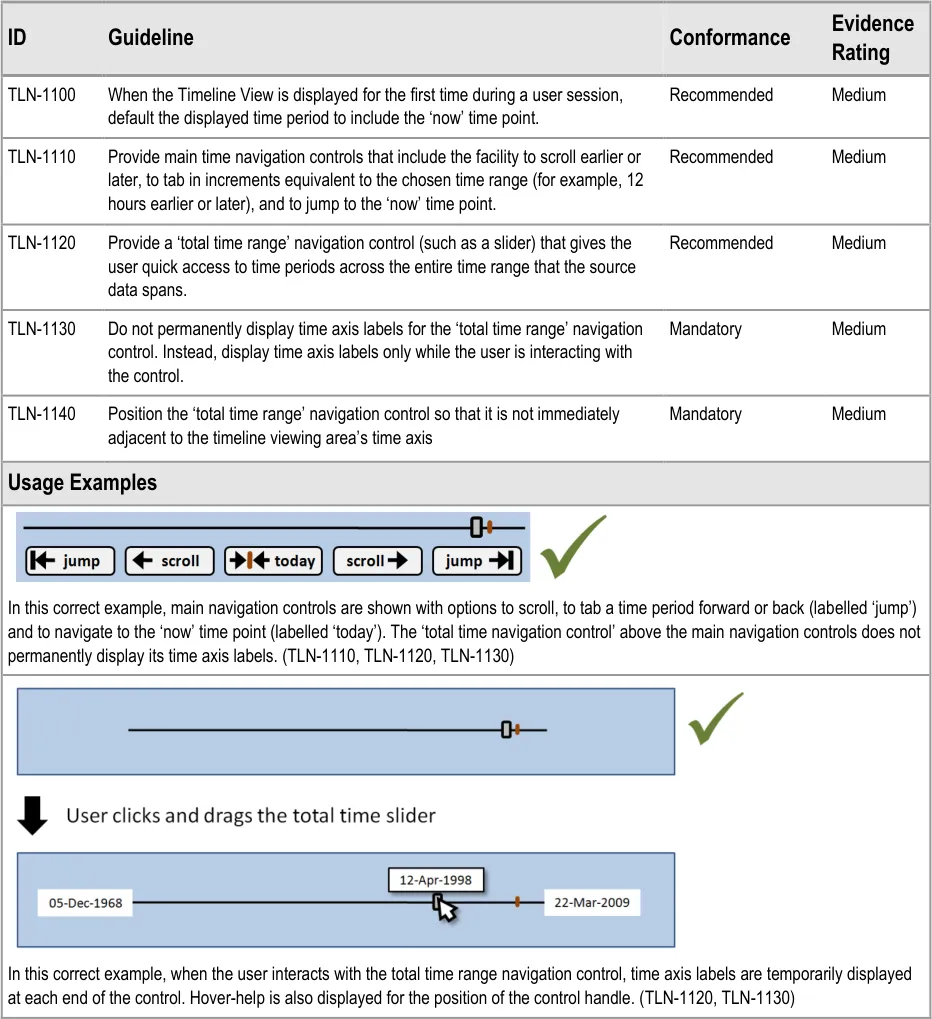
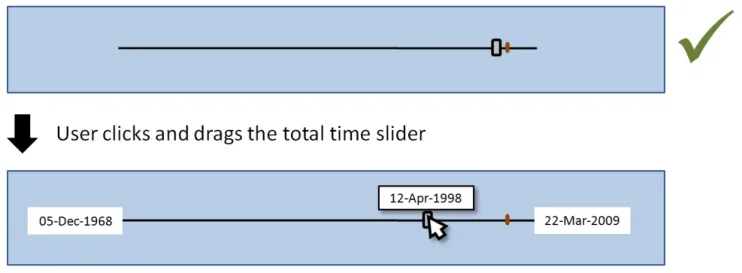
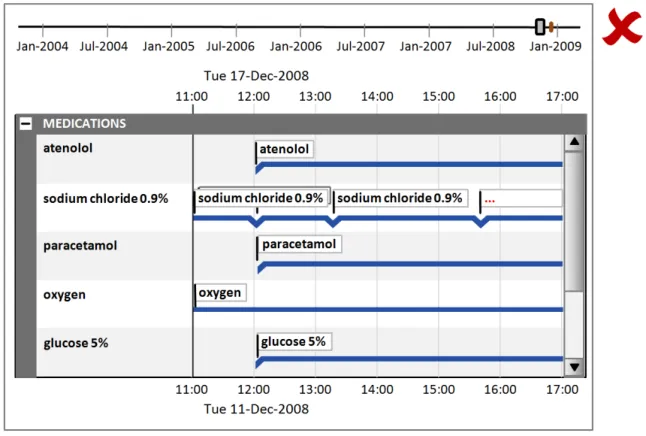
8.2.2 Timeline Global Navigation Options
Page 58
Copyright ©2013 Health and Social Care Information Centre
 HSCIC Controlled Document
Page 59
Copyright ©2013 Health and Social Care Information Centre
HSCIC Controlled Document
8.2.3 Timeline Row-Level Navigation Options
Page 60
Copyright ©2013 Health and Social Care Information Centre
HSCIC Controlled Document
9 DOCUMENT INFORMATION
9.1 Terms and Abbreviations
CATR Clinical Authority to Release
CSG Clinical Safety Group
CUI Common User Interface
EMS Event Management System
ENT Ear, Nose and Throat
HCP Health Care Professional
INR International Normalised Ratio
ISMP The Institute for Safe Medication Practices
ISO International Organization for Standardization
LoD Level of Detail
NHS National Health Service
NHS CFH NHS Connecting for Health
NPfIT National Programme for Information Technology
NPSA National Patient Safety Agency
UI User Interface
VDT Visual Display Terminal
WHO World Health Organization
Table 7: Terms and Abbreviations
9.2 Definitions
The Authority The organisation implementing the NHS National Programme for IT (currently NHS Connecting for Health).
Conformance In the guidance tables, indicates the extent to which you should follow the guideline when defining your UI implementation. There are two levels:
Mandatory - An implementation should follow the guideline
Recommended - An implementation is advised to follow the guideline
Current best practice Current best practice is used rather than best practice, as over time best practice guidance may change or be
revised due to changes to products, changes in technology, or simply the additional field deployment experience that comes over time.
Page 61
Copyright ©2013 Health and Social Care Information Centre
HSCIC Controlled Document
Evidence Rating In the guidance tables, summarises the strength of the research defining the guideline and the extent to which it mitigates patient safety hazards. There are three ratings (with example factors used to determine the appropriate rating):
Low:
Does not mitigate specific patient safety hazards
User research findings unclear and with few participants
Unreferenced usability principles indicate the design is not significantly better than alternatives
Medium:
Mitigates specific patient safety hazards
User research findings clear but with few participants
References old authoritative guidance (for example, from National Patient Safety Agency (NPSA),
Institute for Safe Medication Practices (ISMP) or World Health Organization (WHO)) that is potentially soon to be superseded
Referenced usability principles indicate the design is significantly better than alternatives
High:
Mitigates specific patient safety hazards
User research findings clear and with a significant number of participants
References recent authoritative guidance (for example, from NPSA, ISMP or WHO)
Referenced usability principles indicate the design is significantly better than alternatives
NHS Entity Within this document, defined as a single NHS organisation or group that is operated within a single technical infrastructure environment by a defined group of IT administrators.
Table 8: Definitions
9.3 Nomenclature
This section shows how to interpret the different styles used in this document to denote various types of information.
9.3.1 Body Text
Code Monospace
Script
Other markup languages
Interface dialog names Bold
Field names
Controls
Folder names Title Case
File names
Table 9: Body Text Styles
Page 62
Copyright ©2013 Health and Social Care Information Centre
HSCIC Controlled Document
9.3.2 Cross-References
Current document – sections Section number only
Current document – figures/tables Caption number only
Other project documents Italics and possibly a footnote
Publicly available documents Italics with a footnote
External Web-based content Italics and a hyperlinked footnote
Table 10: Cross-Reference Styles
9.4 References
R1. Timelines in Health care – Gill, Dr Jasdeep K.(Internal NHS CFH research) March 2009
R2. Nielsen, J: Usability Engineering, 1993 1993
R3. Shneiderman, B: Designing the User Interface – Strategies for Effective Human-Computer Interaction, 1998
R4. British Standards Institute, BS EN ISO 9241-10: 1996 Ergonomic requirements for office work with visual display terminals (VDTs) – Part 10: Dialogues principles
Third Edition
1996
R5. NHS CUI Programme – Displaying Graphs and Tables – User Interface Design Guidance 2.0.0.0
R6. NHS CUI Programme – Medications Management – Drug Administration – User Interface Design Guidance
R7. NHS CUI Programme – Medications Management – Medication Line – User Interface Design Guidance
R8. NHS CUI Programme – Medications Management – Medications List – User Interface Design Guidance
R9. Aligning temporal data by sentinel events: discovering patterns in electronic health records. In Proceeding of the Twenty-Sixth Annual SIGCHI Conference on Human Factors in Computing Systems - Wang, T. D., Plaisant, C., Quinn, A. J., Stanchak, R., Murphy, S., and Shneiderman, B. 2008
R10. Gaining New Medical Insights through Interactive Visual Exploration - Aigner, Miksch
R11. LifeLines: Using Visualization to Enhance Navigation and Analysis of Patient Records - HCIL Technical Report 1998 - Plaisant, Mushlin, Snyder, Heller, Shneiderman
R12. LifeLines: Visualizing Personal Histories - ACM CHI 1996 - Plaisant, Milash, Rose, Widoff, Shneiderman
R13. TimeLine: Visualizing Integrated Patient Records - IEEE Trans. On Information Technology in Biomedicine, Vol. 11, No. 4, July 2007 - Bui, Aberle, Kangarloo
R14. Viewing personal history records: A comparison of Tabular format and graphical presentation using LifeLines - Alonso, Rose, Plaisant, Norman
R15. NHS CUI Programme – Medications Management – Search and Prescribe – User Interface Design Guidance
R16. NHS CFH – dm+d Implementation Guide (Secondary Care) http://www.connectingforhealth.nhs.uk/systemsandservices/eprescribing/refdocs
Table 11: References
Copyright ©2013 Health and Social Care Information Centre
4.0.0.0
2.0.0.0
1.0.0.0
2008
1998
1996
July 2007
1997
1.0.0.0
24-Jun-2009
Page 63
HSCIC Controlled Document
APPENDIX A USABILITY PRINCIPLES
A.1 Nielsen’s Usability Heuristics
See Usability Engineering {R2} for more information on these principles:
Visibility of system status
Match between system and the real world
User control and freedom
Consistency and standards
Error prevention
Recognition rather than recall
Flexibility and efficiency of use
Aesthetic and minimalist design
Help users recognise, diagnose, and recover from errors
Help and documentation
A.2 Shneiderman’s Eight Golden Rules of Interface Design
See Designing the User Interface – Strategies for Effective Human-Computer Interaction {R3} for more information on these principles:
Strive for consistency
Enable frequent users to use shortcuts
Offer informative feedback
Design dialogs to yield closure
Offer error prevention and simple error handling
Permit easy reversal of actions
Support internal locus of control
Reduce short-term memory load
Page 64
Copyright ©2013 Health and Social Care Information Centre
HSCIC Controlled Document
A.3 ISO 9241: Characteristics of Presented Information
See Ergonomic requirements for office work with visual display terminals (VDTs) — Part 10: Dialogues principles {R4} for more information on these principles:
Clarity (the information content is conveyed quickly and accurately)
Discriminability (the displayed information can be distinguished accurately)
Conciseness (users are given only the information necessary to accomplish the task)
Consistency (the same information is presented in the same way throughout the application, according to the user’s expectation)
Detectability (the user’s attention is directed towards information required)
Legibility (information is easy to read)
Comprehensibility (meaning is clearly understandable, unambiguous, interpretable and recognisable)
Page 65
Copyright ©2013 Health and Social Care Information Centre
HSCIC Controlled Document
APPENDIX B STUDY ID 33: EXECUTIVE SUMMARY
B.1 Abstract
The UK National Health Service (NHS) Common User Interface (CUI) programme is a partnership between Microsoft [®] and NHS Connecting for Health (NHS CFH), which is part the NHS National Programme for Information Technology (NPfIT).
As part of CUI, the Clinical Applications and Patient Safety (CAPS) Project has the goal of ensuring that software applications used by the NHS enhance patient safety. To achieve this, CAPS provides software developers with user interface design guidelines derived through a user-centric development process that includes explicit patient-safety evaluations.
This summary describes key findings from user research carried out in April 2009 by the CUI CAPS team on the display of clinical data in a Timeline View. These findings are a subset from a larger internal report prepared for the CUI CAPS Timeline team.
Purpose:
To gain clinical feedback on design concepts for Timeline Views of clinical data (primarily medications) in electronic systems.
Method:
Interviews: structured interviews with 13 Health Care Professionals (HCPs) eliciting HCP preferences and qualitative feedback on design alternatives.
Key Results:
Based on clinician preference and rationale:
- The distinction between prescription item and medication administration items should be
clearer
- Options for alternative marking of future duration items should be considered, including
having the same representation for past and future
- The canvas background should mark a distinction between past and future. However, this
should be subtle and take into account readability of all the elements on the canvas (including gridlines)
-
The ability to view labels both inline and in a left column should be considered
-
The ability for the clinician to vary the level of detail and line identity should be retained (for
example, the ability to aggregate prescriptions to the ‘drug name’ level)
- Further methods for reorganising large datasets and indicating data out of view should be
explored
B.2 Research Objectives
To gather HCP design preferences and qualitative feedback on, and to identify possible patient safety hazards with, CUI Timeline View designs.
Page 66
Copyright ©2013 Health and Social Care Information Centre
HSCIC Controlled Document
B.3 Research Design
Interviews were structured, lasted one hour and carried out in person or by telephone. Participants were taken through wireframe design alternatives for each area of investigation and a Microsoft [®] Office Excel [®] mockup, and then asked for preference based on patient safety criteria. Other qualitative feedback was elicited covering:
-
Rationale for preference
-
Design fit with current and best practice
-
Design understandability
-
Any potential hazards resulting from the designs.
Detailed notes from the interviews were qualitatively analysed using thematic coding.
B.4 Results
B.4.1 Participant Description
13 participants were interviewed separately. Each had either volunteered through the NHS CFH Event Management System (EMS) signup or had been recruited by an HCP who had volunteered. Four out of 13 participants had previously taken part in CUI clinical engagement for other work areas. Table 12 shows a summary of the participants’ profiles:
389 Nurse Practitioner Emergency Senior Walk-in centre Various
390 Nurse Practitioner Renal Outpatients Senior Large Hospital A PAS, Path, PACS
391 Doctor Surgery CT1 Teaching Hospital A PAS, Path, PACS, eTTAs
392 Pharmacist and Analyst
Systems Senior Teaching Hospital B PICS and various
393 Doctor Obstetrics and Gynaecology
394 Doctor Obstetrics and Gynaecology
395 Doctor Obstetrics and Gynaecology
396 Doctor Obstetrics and Gynaecology
F1 Teaching Hospital C PAS, Path, PACS, eTTAs, iSOFT [®] Synergy, EMIS [®] LV™,
F1 Teaching Hospital C PAS, PACS, Path, iSOFT i.Clinical Manager
F1 Teaching Hospital C PAS, PACS, Path
F2 Teaching Hospital C PAS, PACS, Path, EMIS, INPS Vision
397 Pharmacist? Senior Teaching Hospital C PAS, PACS, Path, eTTAs, iMDsoft [®] MetaVision
398 Nurse Stroke? DGH PAS
399 Doctor Ear, Nose and Throat (ENT)
400 Doctor Clinical Pharmacology
Research Fellow
Research fellow
DGH PAS, PACS, Path
Large hospital B PAS, PACS, Path, eTTAs, an ePrescribing system
401 Nurse ENT Sister DGH PAS
Table 12: Interview Participants
Copyright ©2013 Health and Social Care Information Centre
Page 67
HSCIC Controlled Document
All participants were clinical staff who had experience of viewing clinical data such as medications in an inpatient setting. Participants were scoped to secondary care (and mainly inpatient care) as per the scope and example datasets for the CUI timelines work.
The 10 secondary care participants were from a number of different trusts different trusts, with diverse geographical locations.
All participants had used some kind of electronic patient record, though only one (participant 397) had used electronic timeline displays of clinical data before. The majority had medium computer experience, where high experience includes items such as being familiar with spreadsheet calculation functions and having an understanding of databases.
B.4.2 Design Areas
Bullet text in italics represents researcher recommendations or comments in order to distinguish them from user feedback.
Duration Items – General
- Participants made various errors in misinterpreting the ‘prescription’ duration items as
medication administration status indicators:
Therefore, continue to allow the display of medication administration items (to clarify the ambiguity)
Consider how the ambiguity could be further clarified (for example, with a default setting for inpatient contexts that showed medication administration whenever showing medication data)
- One participant assumed an item start date was when the item appeared on screen on the
left:
Ensure it is clear where items start or stop
Duration Items – Future Items
- Examples of different styling for ‘future’ items raised a variety of feedback, with concerns
raised about items potentially being mistaken as ‘progress bars’, or wide-dotted items as separate events, and more complex styling resulting in an overly ‘busy’ view
- Several participants suggested that planned items (such as prescriptions) should not look
different in the past and future as the plan to have them was certain, even though the future is by nature uncertain:
Therefore, consider the potential risks of misinterpretation. If the line does change it might be more likely to be misinterpreted as a status indicator
Consider the balance between redundant cues and overall visual weight (that is, if future is already conveyed by a canvas background change, is line styling change necessary?)
Discrete Items
- Some icons are potentially confusable with others:
Reduce sharing of visual attributes between icon types
- Neither option presented for dealing with crowded icons was deemed to be that clear:
Continue to explore, incorporating ‘squashing tolerance’ work from the Displaying Graphs and Tables – User Interface Design Guidance {R5} document
Page 68
Copyright ©2013 Health and Social Care Information Centre
HSCIC Controlled Document
- Though the indication of overdue items was commented on favourably, further consistency
with the Medications Management – Drug Administration – User Interface Design Guidance {R6} should be explored
Canvas Background
- 11 of 12 participants supported having a background shade distinction between past and
future. This was both to draw attention to ‘now’ and to provide extra cues as to whether an item was past or future:
Continue to provide a background shade distinction
- Opinion was divided on what shades to use for current and past, mainly based on
metaphorical reasoning “the future is a blank slate”:
Consider readability implications for using shaded and/or coloured background (for example, darker backgrounds may make it harder to read items and hide gridlines)
Labels
- Most participants preferred having labels both ‘inline’ (to improve the association between
the lines and labels) AND in a left column (to allow for ease of scanning the list and familiarity with current representations of medication lists):
Strongly consider ability to display both ‘inline’ AND ‘left’ labels
Continuous Administration
- Participants made various errors due to the word ‘continuous’:
ePrescribing team to consider naming issue
Thumbnail
- Two participants initially assumed the thumbnail indicated medications started 20 years
before they had:
Consider how to mitigate this error
The thumbnail also continually takes up space, which might be better used for the main data display
Active and Inactive
- Participants mistakenly interpreted the red and green colours representing active and
inactive:
Do not use red and green to indicate status change
- Several participants mistakenly assumed only a few medications were current and/or
active:
Consider how to indicate that other medications are out of view
Consider visual distinction of active and inactive items
Page 69
Copyright ©2013 Health and Social Care Information Centre
HSCIC Controlled Document
Level of Detail and Line Identity
- All participants felt that Level of Detail (LoD) 2 (aggregating lines to the drug name level
with full prescription details hidden) was a useful addition to LoD 4 (seeing each prescription as a separate line with full drug details):
Continue to allow the line identity and level of detail to be varied by the clinician
- Some participants were concerned at being able to see medications without administration
information as this is not current practice in inpatient secondary care:
Consult with the CUI medications team
Item Changes
- Though 5 of 10 participants did not initially understand the meaning of the markers to
indicate item change (in this case, a change in prescription), once understood all supported the need to clearly mark this:
Continue to display markers of item change when line identity is shrunk
Representing ‘Health Issues’
- Many issues were raised about the representation of patient problems/health issues,
especially regarding line identity, ‘?’ problems and the differences between symptoms and diagnoses:
Consider these issues in future clinical noting work
- Being able to vary line identity helped participants understand the nature of the problems:
Consider these issues in future clinical noting work
Navigation and Large Datasets
- Navigating the large (and arguably more realistic) dataset was very problematic for the few
participants it was shown to:
Consider guidance on minimising the amount of vertical space each row takes up to get more in a single screen
Continue to explore other methods for reorganising data (for example, filtering, sorting and grouping) and for indicating data out of view
Page 70
Copyright ©2013 Health and Social Care Information Centre
HSCIC Controlled Document
REVISION AND SIGNOFF SHEET
Change Record
08-Jun-2009 Steve Loader 0.0.0.1 Initial draft for review/discussion
10-Jun-2009 Andy Payne, James Fone
0.0.0.2 Updated document including rationale and risk mitigation
11-Jun-2009 Andy Payne 0.0.1.0 Updated document for Authority review
17-Jun-2009 Graham Hoare/ Simon Burnham
02-Jul-2009 Andy Payne/ James Fone/ Steve Loader
0.0.1.1 Initial copyedit – first pass complete
0.0.1.2 Extensive additions and modifications following NHS CFH and copyedit review
06-Jul-2009 Mick Harney 0.0.1.3 Copyedit on latest draft
07-Jul-2009 Steve Loader 0.0.1.4 Updates following copyedit
07-Jul-2009 Mick Harney 0.0.1.5 Cleanup examples and references and section 5 structure
07-Jul-2009 Mick Harney 0.1.0.0 Raised to Baseline Candidate
08-Jul-2009 Mick Harney 0.2.0.0 Minor corrections and raised to Baseline Candidate #2
31-Jul-2009 Andy Payne 0.2.0.1 Further updates after consultation with NHS CFH
31-Jul-2009 Mick Harney 0.3.0.0 Raised to Baseline Candidate #3
05-Aug-2009 Mick Harney 1.0.0.0 Raised to Baseline
Document Status has the following meaning:
- Drafts 0.0.0.X - Draft document reviewed by the Microsoft CUI Project team and the
Authority designate for the appropriate Project. The document is liable to change.
- Working Baseline 0.0.X.0 - The document has reached the end of the review phase and
may only have minor changes. The document will be submitted to the Authority CUI Project team for wider review by stakeholders, ensuring buy-in and to assist in communication.
- Baseline Candidate 0.X.0.0 - The document has reached the end of the review phase and
it is ready to be frozen on formal agreement between the Authority and the Company.
- Baseline X.0.0.0 - The document has been formally agreed between the Authority and the
Company.
Note that minor updates or corrections to a document may lead to multiple versions at a particular status.
Open Issues Summary
None
Page 71
Copyright ©2013 Health and Social Care Information Centre
HSCIC Controlled Document
Audience
The audience for this document includes:
- Authority CUI Manager / Project Sponsor . Overall project manager and sponsor for the
NHS CUI project within the Authority
- Authority Clinical Applications and Patient Safety Project Project Manager.
Responsible for ongoing management and administration of the Project
- The Authority Project Team . Responsible for jointly agreeing with the Company NHS CUI
Project Team the approach defined in this document and any necessary redefinition of the Clinical Applications and Patient Safety Project strategy that results from the document or approach agreed
- Company NHS CUI Team . Responsible for agreeing with the Authority Project Team the
approach defined in this document, including any necessary redefinition of the Clinical Applications and Patient Safety Project strategy that results from the document or approach agreed
Reviewers
Mike Carey Workstream Lead
Tim Chearman UX Architect
Peter Johnson Clinical Architect
Frank Cross Clinical Advisor
Mike Clements Clinical Advisor
Beverley Scott Clinical Safety Officer
Distribution
Mike Carey Workstream Lead
Tim Chearman UX Architect
Peter Johnson Clinical Architect
Frank Cross Clinical Advisor
Mike Clements Clinical Advisor
Beverley Scott Clinical Safety Officer
Page 72
Copyright ©2013 Health and Social Care Information Centre
HSCIC Controlled Document
Document Properties
Document Title Timeline View User Interface Design Guidance
Author Clinical Applications and Patient Safety Project
Restrictions RESTRICTED – COMMERCIAL; MICROSOFT COMMERCIAL; Access restricted to: NHS CUI Project Team, Microsoft NHS Account Team
Creation Date 8 June 2009
Last Updated 23 June 2015
Copyright:
You may re-use this information (excluding logos) free of charge in any format or medium, under the terms of the Open Government Licence. To view this licence, visit nationalarchives.gov.uk/doc/open-government-licence or email psi@nationalarchives.gsi.gov.uk.
Page 73
Copyright ©2013 Health and Social Care Information Centre